ETFs With Low P/S Ratios May Be The Only Bargains Left
Pacific Park Financial Inc. | Jul 08, 2014 01:55AM ET
The 30 companies that comprise the Dow Jones Industrials collectively failed to increase sales in 2013. Yet the price of the Dow surged more than 25%. And while that price appreciation for the big-time benchmark may be slowing, the Dow still managed to eclipse 17,000 without generating much in the way of actual revenue growth.
Sales at S&P 500 corporations have also been unimpressive. According to Howard Silverblatt, a senior index analyst at S&P Capital IQ, aggregate sales per share for S&P 500 constituents registered $2.49 billion in Q1 of 2014. Back near the last bear market’s inception in Q1 of 2008 that number was $2.65 billion. If Silverblatt is correct, one method of measuring revenue strength (i.e., sales-per-share) is less vibrant today than during the beginning of the Great Recession.
Of course, analysts keep drilling home the notion that the bull market rests on the trajectory of corporate earnings. The problem with relying on the profitability data alone is that the data is being manipulated. Record low interest rates since the end of 2008 have fostered binge borrowing by corporations and the subsequent financing of nearly $2 trillion in stock buybacks (Q1 2009 – Q1 2014). The effect? A misguided perception that earnings are barreling forward. In truth, earnings-per-share appear strong because buybacks reduce the number of shares in existence, artificially reducing the trumpeted price-to-earnings (P/E) ratio.
It is also worth noting that the current price-to-sales (P/S) ratio for the S&P 500 (1.77) is roughly 25% higher than the median P/S in the 21st century (1.42). The historical mean since the market benchmark began? Around 0.9. It follows that most folks can reasonably assume that U.S. stocks are quite expensive in the context of the revenue that corporations have been generating.
The concern led me to identify a handful of broader-based U.S. ETFs with substantially lower price-to-sales numbers than the S&P 500. The ratios in the table below come from the most recent Morningstar data feed and/or a provider’s web site:
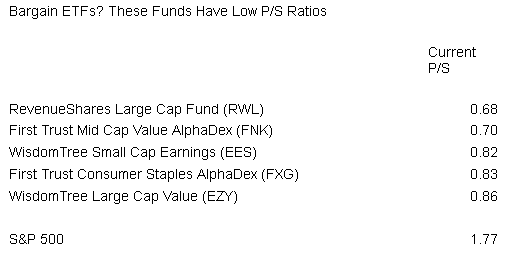
Let’s consider WisdomTree Small Cap Earnings Fund (NYSE:EES). Not only is its price-to-sales a better “deal” than the S&P 500, but EES boasts a trailing 12-month P/E that is 12.3% lower than that of the S&P 500 and 24.7% lower than iShares Russell 2000 Small Cap Index (ARCA:IWM). Sales-per-share might not be the only metric, but perhaps we should not ignore it either.
Some might wonder whether there is any evidence to support whether the sales data even matters. This may be difficult to quantify. However, over the last three years, EES has produced 10 percentage points more than its benchmark competitor. Perhaps 1000 basis points is worthy of additional investigation.
What if we bring the 2007-2009 bear market collapse into play? After all, if a potential investment is a bargain, shouldn’t it hold up better than its competitors under extreme pressure? Unfortunately, EES did not show a capacity to “lose less” in the bearish collapse. On the other hand, the outperformance by EES over IWM across seven-and-a-half years jumps to 20 percentage (2000 basis) points.
Let’s take a look at another example from the table above, RevenueShares Large Cap (NYSE:RWL). This ETF trades close to a 10% P/E discount to the S&P 500, in addition to its formidable P/S bargain. Unfortunately, RWL did not provide inherent downside protection in the 2007-2009 bear. Yet one can point to longer-term benefits of fundamental value, including a 15 percentage point (1500 basis point) spread above the S&P 500 SPDR Trust (ARCA:SPY) in the period investigated.
In sum, if you are less concerned about extreme depreciation over the shorter term, and you’re comfortable with holding-n-hoping over the next decade, lower P/S ETFs show an ability to outperform. On the other hand, if you’re like me, you believe in the importance of protection. My clients certainly want me to minimize damage to account values during a bearish downtrend. That’s why I use stop-limit orders and trendlines to raise cash levels in unusually dangerous times. Equally important, I employ hedges and non-correlated assets to lessen the impact of sharp sell-offs.
Disclosure: Gary Gordon, MS, CFP is the president of Pacific Park Financial, Inc., a Registered Investment Adviser with the SEC. Gary Gordon, Pacific Park Financial, Inc, and/or its clients may hold positions in the ETFs, mutual funds, and/or any investment asset mentioned above. The commentary does not constitute individualized investment advice. The opinions offered herein are not personalized recommendations to buy, sell or hold securities. At times, issuers of exchange-traded products compensate Pacific Park Financial, Inc. or its subsidiaries for advertising at the ETF Expert web site. ETF Expert content is created independently of any advertising relationships.
Trading in financial instruments and/or cryptocurrencies involves high risks including the risk of losing some, or all, of your investment amount, and may not be suitable for all investors. Prices of cryptocurrencies are extremely volatile and may be affected by external factors such as financial, regulatory or political events. Trading on margin increases the financial risks.
Before deciding to trade in financial instrument or cryptocurrencies you should be fully informed of the risks and costs associated with trading the financial markets, carefully consider your investment objectives, level of experience, and risk appetite, and seek professional advice where needed.
Fusion Media would like to remind you that the data contained in this website is not necessarily real-time nor accurate. The data and prices on the website are not necessarily provided by any market or exchange, but may be provided by market makers, and so prices may not be accurate and may differ from the actual price at any given market, meaning prices are indicative and not appropriate for trading purposes. Fusion Media and any provider of the data contained in this website will not accept liability for any loss or damage as a result of your trading, or your reliance on the information contained within this website.
It is prohibited to use, store, reproduce, display, modify, transmit or distribute the data contained in this website without the explicit prior written permission of Fusion Media and/or the data provider. All intellectual property rights are reserved by the providers and/or the exchange providing the data contained in this website.
Fusion Media may be compensated by the advertisers that appear on the website, based on your interaction with the advertisements or advertisers.