ES 2200: Is It Possible?
Trader Moe | Jun 24, 2015 12:48AM ET
In order for ES to break out upwards on a sustained run to a substantially higher high, it needs to get bears back in the game.
What this would take is something like a large, clear H&S on the daily chart, with a lot of people shorting at the expected area of the right shoulder top. A right shoulder failure and an upwards breakout from the H&S would melt the market up to a substantially higher high.
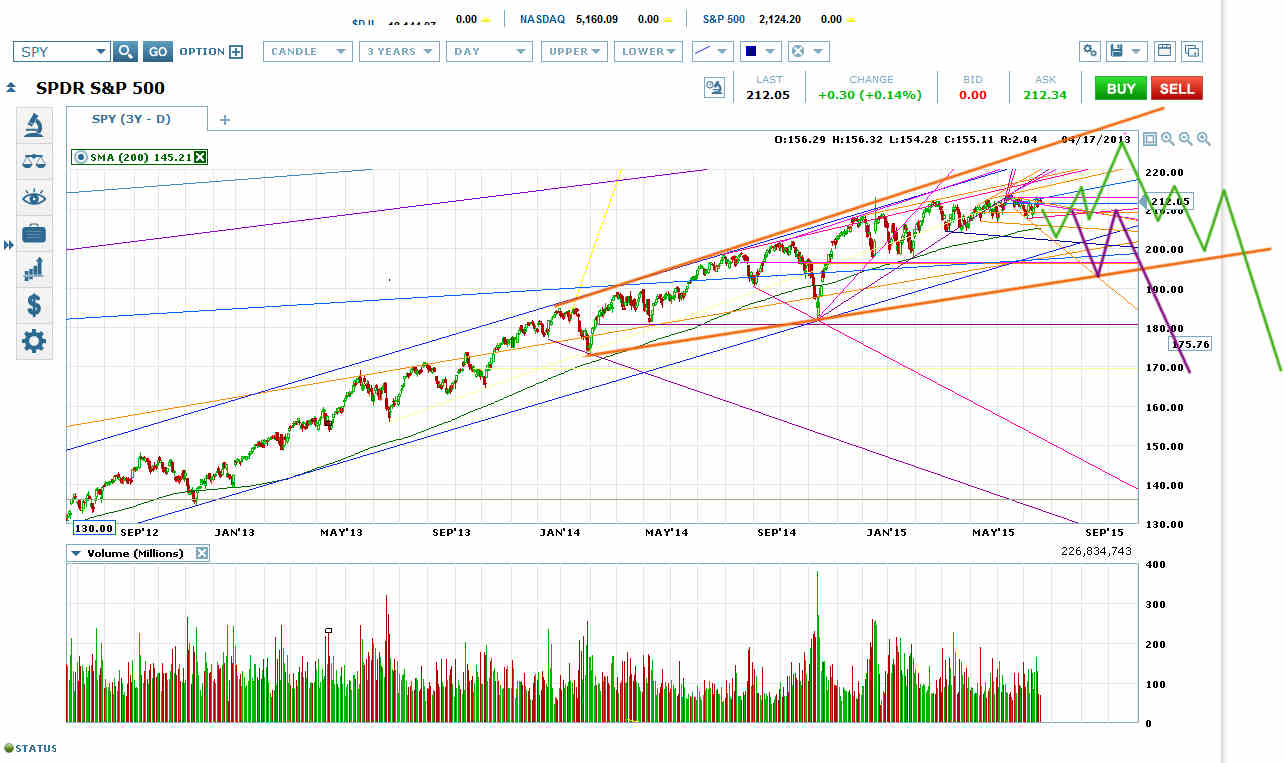
But once ES reaches the bottom of its long-term rising megaphone top (orange on chart above), the top would almost always be in. There is usually a bounce off the bottom of a rising megaphone, but that bounce usually puts a right shoulder on an H&S that will actually break out downwards.
So one way to look at the long-term SPDR S&P 500 (ARCA:SPY) or ES chart is that it’s working right now on the head of a head and shoulders that is working the price across the orange rising megaphone for a breakout downwards. That head could still take the price a lot higher, but the market probably needs to move lower first to recharge for such a move.
And ES has to move down to the March low soon to preserve the bullish option. The bottom of the orange rising megaphone is an up-tilting line. If ES moves sideways too much longer before retracing to the March low, it will run into the bottom of the orange rising megaphone on that retrace, and that would usually be a sign of impending doom.
Original post
![]()
Trading in financial instruments and/or cryptocurrencies involves high risks including the risk of losing some, or all, of your investment amount, and may not be suitable for all investors. Prices of cryptocurrencies are extremely volatile and may be affected by external factors such as financial, regulatory or political events. Trading on margin increases the financial risks.
Before deciding to trade in financial instrument or cryptocurrencies you should be fully informed of the risks and costs associated with trading the financial markets, carefully consider your investment objectives, level of experience, and risk appetite, and seek professional advice where needed.
Fusion Media would like to remind you that the data contained in this website is not necessarily real-time nor accurate. The data and prices on the website are not necessarily provided by any market or exchange, but may be provided by market makers, and so prices may not be accurate and may differ from the actual price at any given market, meaning prices are indicative and not appropriate for trading purposes. Fusion Media and any provider of the data contained in this website will not accept liability for any loss or damage as a result of your trading, or your reliance on the information contained within this website.
It is prohibited to use, store, reproduce, display, modify, transmit or distribute the data contained in this website without the explicit prior written permission of Fusion Media and/or the data provider. All intellectual property rights are reserved by the providers and/or the exchange providing the data contained in this website.
Fusion Media may be compensated by the advertisers that appear on the website, based on your interaction with the advertisements or advertisers.