E-mini Breakout Test Of October 6 Trading Range High
Al Brooks | Oct 16, 2020 09:46AM ET
Yesterday gapped down and therefore created a 3-day island top. The bears were hoping that this was the start of a reversal down from a double top with the September high, and the start of a bear trend. But yesterday rallied from the open and closed the gap below Wednesday’s low. There will probably be at least a small test up before the bears will try again.
The bulls are hoping that the E-mini will now reverse up from the pullback to test the Oct. 6 high. That is the top of a month-long trading range within the 2-month trading range. They see the 3-day selloff as an E-mini breakout test for last week’s breakout. Since the 3-day selloff was fast and deep, the E-mini might have to go sideways for a couple days before the bulls will be able to resume last week’s rally.
Because today is Friday, weekly support and resistance can be important, especially in the last hour. Traders will pay attention to the open of the week. The bulls want today to close above Monday’s open. This week’s candlestick would then have a bull body, which would reduce the chance of a reversal down next week.
Overnight E-mini Globex Trading
The E-mini is up 12 points in the Globex session. Since yesterday is a reasonable buy signal bar near support on the daily chart, today will probably trade above yesterday’s high. That will trigger the buy signal.
In fact, the E-mini will probably gap above yesterday’s high on the open. If the gap is small, traders will look for it to close in the 1st hour.
But they will also look for a reversal up from any early selloff. This is because there are a couple magnets above. Both are near one another. There is the 3500 Big Round Number and the Open of the week. The bulls will try to prevent this week’s candlestick on the weekly chart from having a bear body.
The open of the week is only about 10 points above the current Globex price. When a market is near a magnet, it usually will reach the magnet. It will then decide whether to reverse down or break above.
After this week’s Big Up, Big Down, there is Big Confusion. That tends to result in a lot of trading range trading. Therefore, there is an increased chance of a trading range day today with the day closing around the open of the week. This week’s candlestick would then be a doji, which is a 1-bar trading range.
Yesterday’s Setups
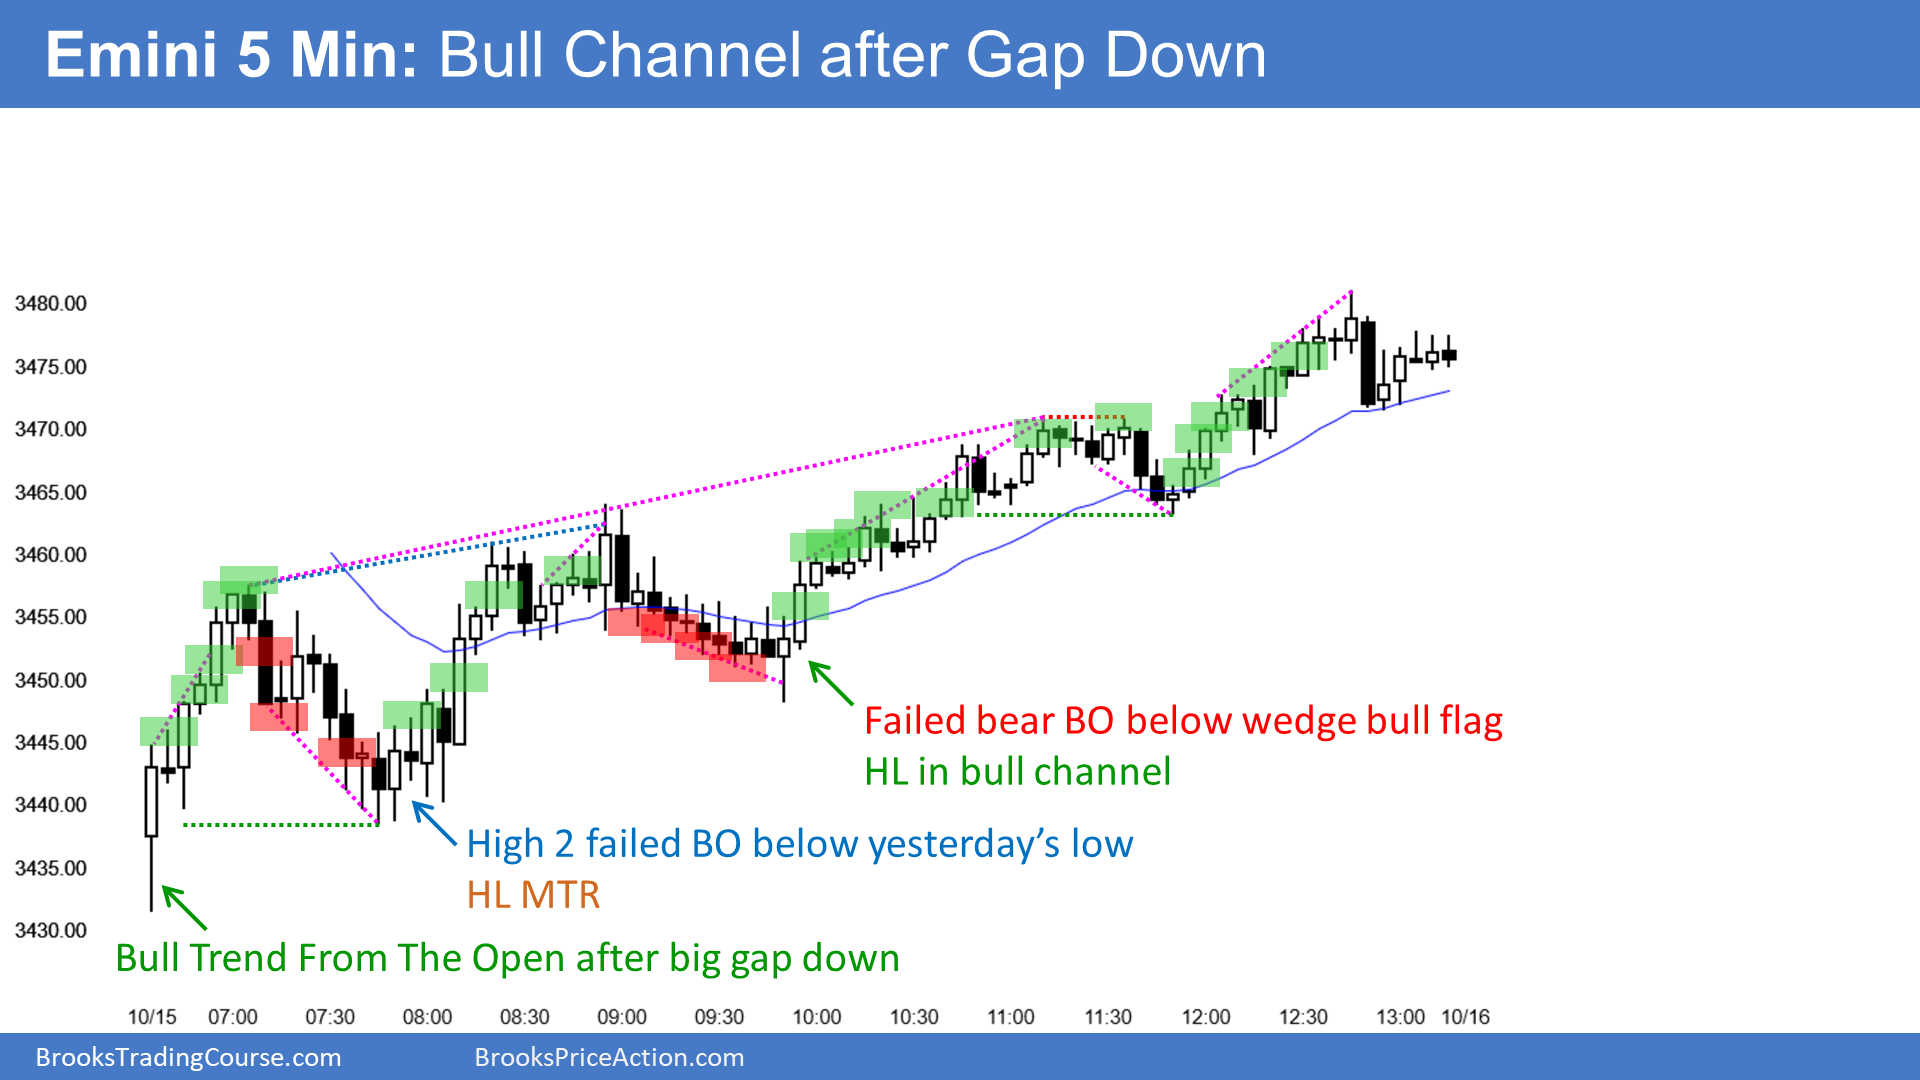
Here are several reasonable stop entry setups from yesterday. I show each buy entry with a green rectangle and each sell entry with a red rectangle. I rarely also show limit order entries and entries on the close of bars. I do not want the lines to be distracting. If they are longer, I make them dotted. But, they have to be visible, so I make the shorter ones solid. Buyers of both the Brooks Trading Course and Encyclopedia of Chart Patterns have access to a much more detailed explanation of the swing trades for each day (see Online Course/BTC Daily Setups).
My goal with these charts is to present an Always In perspective. If a trader was trying to be Always In or nearly Always In a position all day, and he was not currently in the market, these entries would be logical times for him to enter.
If the risk is too big for your account, you should wait for trades with less risk or trade an alternative market like the Micro Emini.
![]()
Trading in financial instruments and/or cryptocurrencies involves high risks including the risk of losing some, or all, of your investment amount, and may not be suitable for all investors. Prices of cryptocurrencies are extremely volatile and may be affected by external factors such as financial, regulatory or political events. Trading on margin increases the financial risks.
Before deciding to trade in financial instrument or cryptocurrencies you should be fully informed of the risks and costs associated with trading the financial markets, carefully consider your investment objectives, level of experience, and risk appetite, and seek professional advice where needed.
Fusion Media would like to remind you that the data contained in this website is not necessarily real-time nor accurate. The data and prices on the website are not necessarily provided by any market or exchange, but may be provided by market makers, and so prices may not be accurate and may differ from the actual price at any given market, meaning prices are indicative and not appropriate for trading purposes. Fusion Media and any provider of the data contained in this website will not accept liability for any loss or damage as a result of your trading, or your reliance on the information contained within this website.
It is prohibited to use, store, reproduce, display, modify, transmit or distribute the data contained in this website without the explicit prior written permission of Fusion Media and/or the data provider. All intellectual property rights are reserved by the providers and/or the exchange providing the data contained in this website.
Fusion Media may be compensated by the advertisers that appear on the website, based on your interaction with the advertisements or advertisers.