EEM: Upside Trend Continuation Appears Likely
Bruce Powers | Jan 18, 2017 02:38AM ET
Multiple time-frame analysis for iShares MSCI Emerging Markets Index ETF (NYSE:EEM)
Starting with the bigger picture monthly chart let’s review what has happened in the iShares MSCI Emerging Markets EEM in order to have a better idea how the near-term might fit with the larger view.
For several years, from approximately 2011 to 2015, EEM had been consolidating within a range that eventually took the form of a large Symmetrical Triangle pattern. A bearish breakdown occurred in July 2015 leading to an accelerated decline that eventually found support and a bottom at $27.61 in January 2016.
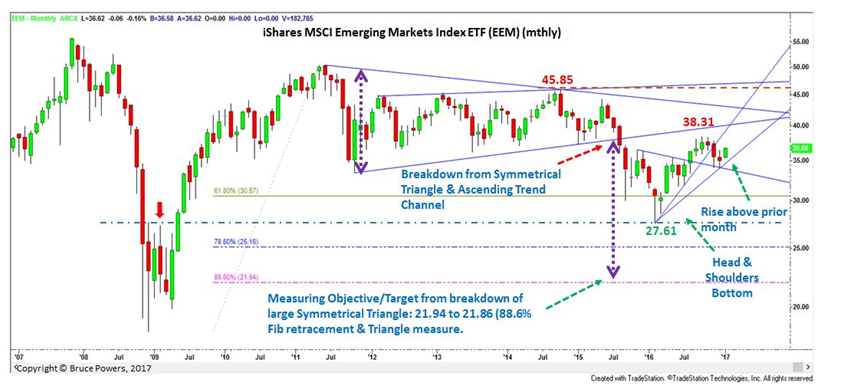
Subsequently, a bullish Head and Shoulders Bottom trend reversal pattern formed with an upside breakout occurring in July of last year and price rising with conviction until hitting resistance in September at $38.31 (2016 high around 200-week resistance and test of resistance at bottom of large Symmetrical Triangle). That’s the top of a consolidation formation that eventually resolved itself to the downside, breaking below the neckline support of the pattern as well as an uptrend line in November 2016.
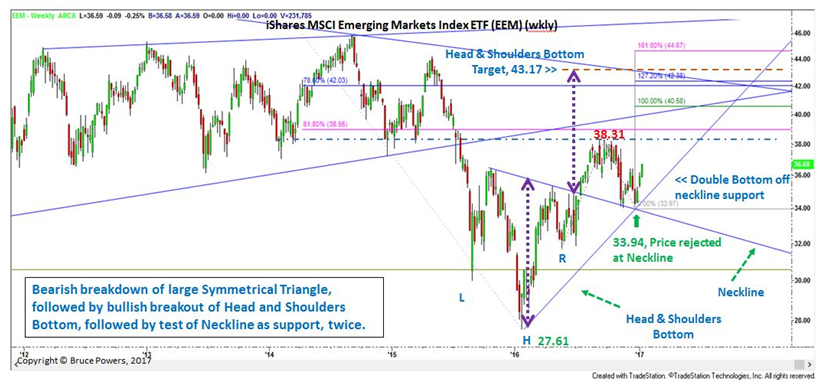
That decline led to two tests of support of the neckline of the Head and Shoulders bottom pattern. Each time the line stopped further selling and a rally followed. This double test of the neckline created a potential Double Bottom trend reversal pattern. A breakout confirmed the pattern last week as it advanced above $36.41.
EEM closed last week at $36.68, near the $36.71 high for the week, and above the prior month’s high. Last week’s high is also right at resistance of the neckline of the consolidation top that ended in November and the 61.8% Fibonacci retracement.
The point of this review is to highlight that price behavior in EEM creates patterns one after the other. Price breaks through key levels represented by a line and then retraces to test that line before continuing on. This is classic bullish behavior.
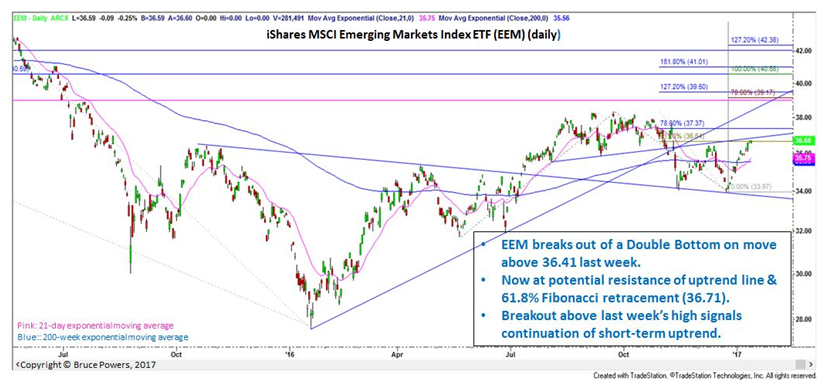
If EEM can close above last week’s high on a daily basis it’s looking like it should continue higher. Potential targets are shown on both the enclosed Daily and Weekly charts as Fibonacci confluence. The first price zone that needs to be exceeded next is the 2016 high of $38.31. If EEM can keep going from there it next targets the $39.17 to $39.50 resistance zone, followed by a range from around $40.58 to $41.01.At the same time, it will be heading up into overhead resistance represented by the Triangle consolidation phase.
If EEM does not get above last week’s high in the near-term, given that it’s at the 61.8% Fibonacci level and trend line, a pullback would not be unexpected before it makes another run higher, if it is to do so. Given that EEM closed last week above the Double Bottom breakout level, an eventual upside trend continuation seems most likely at this point.
Trading in financial instruments and/or cryptocurrencies involves high risks including the risk of losing some, or all, of your investment amount, and may not be suitable for all investors. Prices of cryptocurrencies are extremely volatile and may be affected by external factors such as financial, regulatory or political events. Trading on margin increases the financial risks.
Before deciding to trade in financial instrument or cryptocurrencies you should be fully informed of the risks and costs associated with trading the financial markets, carefully consider your investment objectives, level of experience, and risk appetite, and seek professional advice where needed.
Fusion Media would like to remind you that the data contained in this website is not necessarily real-time nor accurate. The data and prices on the website are not necessarily provided by any market or exchange, but may be provided by market makers, and so prices may not be accurate and may differ from the actual price at any given market, meaning prices are indicative and not appropriate for trading purposes. Fusion Media and any provider of the data contained in this website will not accept liability for any loss or damage as a result of your trading, or your reliance on the information contained within this website.
It is prohibited to use, store, reproduce, display, modify, transmit or distribute the data contained in this website without the explicit prior written permission of Fusion Media and/or the data provider. All intellectual property rights are reserved by the providers and/or the exchange providing the data contained in this website.
Fusion Media may be compensated by the advertisers that appear on the website, based on your interaction with the advertisements or advertisers.