E-Mini S&P Setting Up For Volatile Breakout
The Pattern, Price & Time Report | Jan 17, 2013 05:40AM ET
The March E-mini S&P 500 futures contract is currently sitting inside of a triangle chart pattern bounded by Gann angle resistance at 1467.50 and Gann angle support at 1460.00. The triangle chart pattern is considered by many technical analysts to be a non-trending pattern that indicates impending volatility. The pattern doesn’t predict the direction but does give a trader as to where the market is likely to breakout.
It may the upcoming opinion expiration, or the uncertainty over the debt ceiling debate, but investors have been keeping their distance from the market since they put a near record amount of funds into equities during the first week of the year. The compression of the daily price ranges suggest that something is about to happen to trigger a volatile move.
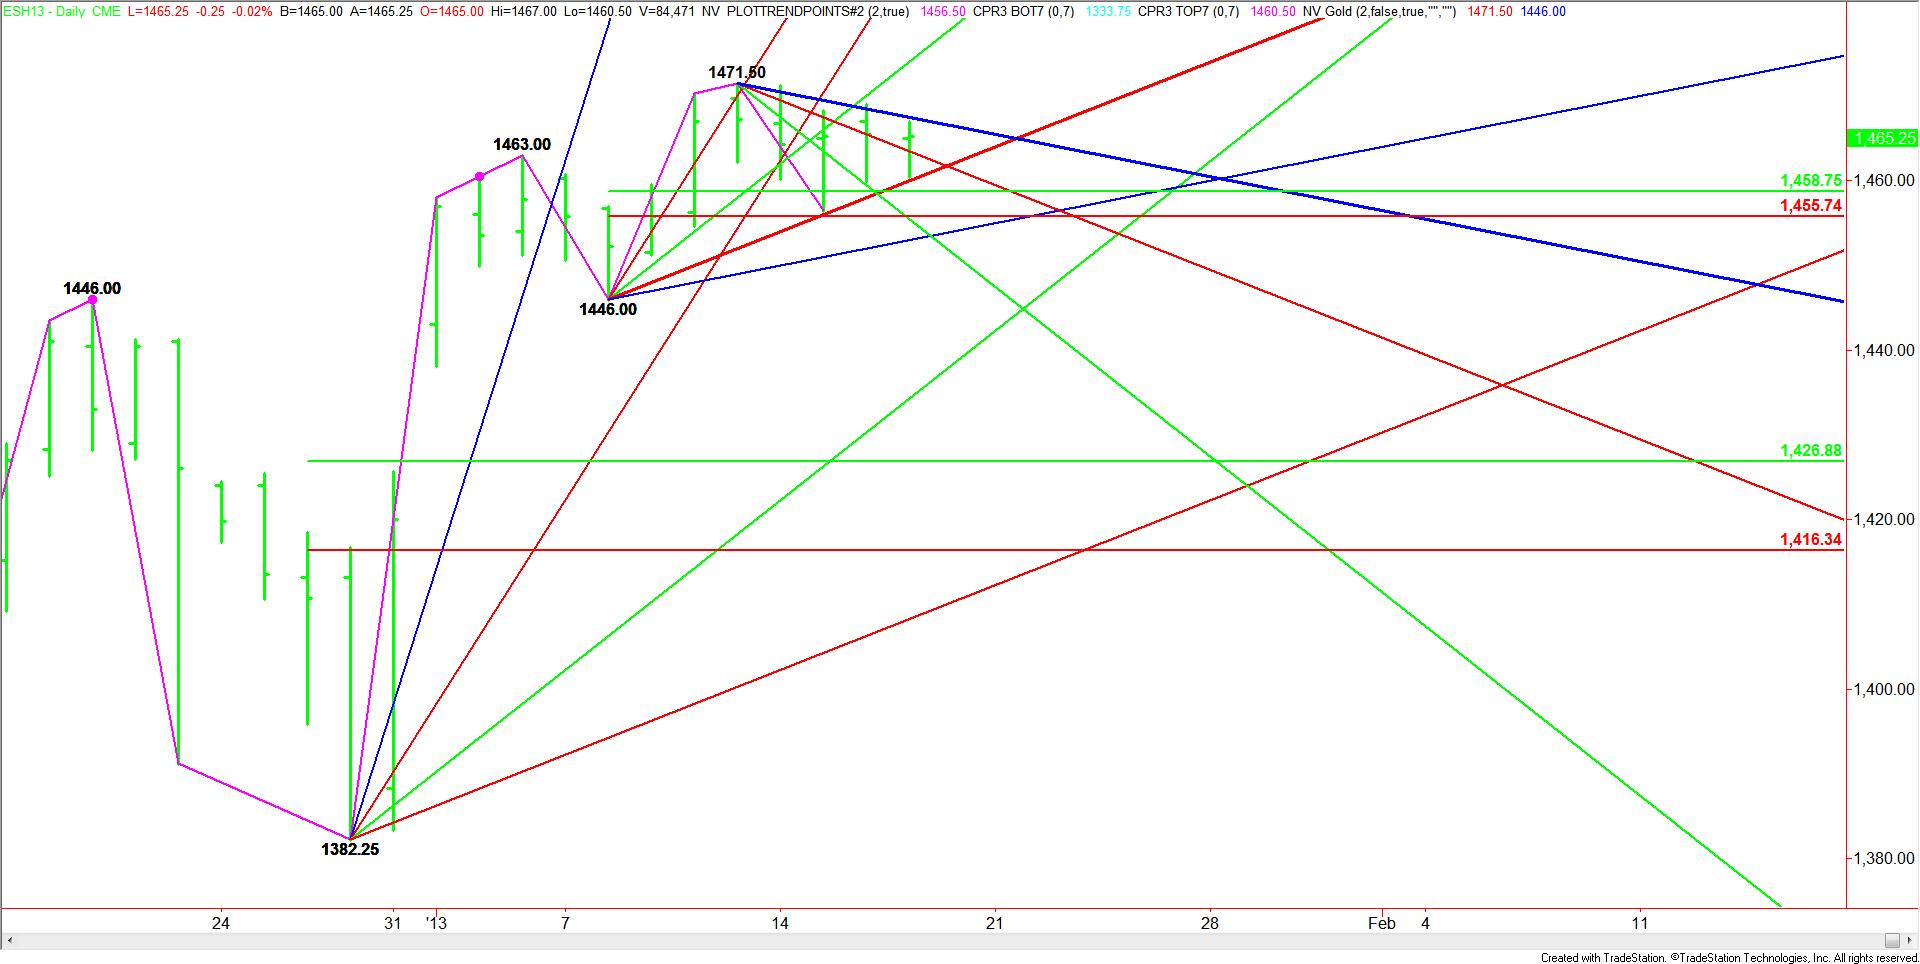
A breakout through 1467.50 is likely to trigger a quick move to the recent top at 1471.50. Beyond this price level is a guess since it is basically uncharted territory.
If investors decide the downside is the way of least resistance, then look for a choppy trade following the first test of a short-term retracement zone at 1458.75 to 1455.75. Once this zone is cleared then the index will take a run at a slow-moving Gann angle at 1.453.00. A failure to hold this level is likely to attract fresh selling pressure that should take the market into a main bottom at 1446.00.
The main trend is still up, but a break through 1446.00 will turn it down. This would be more evidence pointing to an eventual retracement of the 1382.25 to 1471.50 range to 1426.75 to 1416.25.
![]()
Trading in financial instruments and/or cryptocurrencies involves high risks including the risk of losing some, or all, of your investment amount, and may not be suitable for all investors. Prices of cryptocurrencies are extremely volatile and may be affected by external factors such as financial, regulatory or political events. Trading on margin increases the financial risks.
Before deciding to trade in financial instrument or cryptocurrencies you should be fully informed of the risks and costs associated with trading the financial markets, carefully consider your investment objectives, level of experience, and risk appetite, and seek professional advice where needed.
Fusion Media would like to remind you that the data contained in this website is not necessarily real-time nor accurate. The data and prices on the website are not necessarily provided by any market or exchange, but may be provided by market makers, and so prices may not be accurate and may differ from the actual price at any given market, meaning prices are indicative and not appropriate for trading purposes. Fusion Media and any provider of the data contained in this website will not accept liability for any loss or damage as a result of your trading, or your reliance on the information contained within this website.
It is prohibited to use, store, reproduce, display, modify, transmit or distribute the data contained in this website without the explicit prior written permission of Fusion Media and/or the data provider. All intellectual property rights are reserved by the providers and/or the exchange providing the data contained in this website.
Fusion Media may be compensated by the advertisers that appear on the website, based on your interaction with the advertisements or advertisers.