Dow Makes A Hero Of The Investor, After Killing Him With Divergences
Sid Klein | Aug 11, 2021 06:17PM ET
This report’s four charts illustrate the unsustainable divergences that will have re-evaluated the Dow to levels more than 50% lower, and sent precious metals “substantially” higher.
Though the divergences are the products of irrational behavior and illogical short- and intermediate-term market drivers, the charts do not lie.
“You can be right, but you might be dead first.”
This is what my mentor said to me 40 years ago. So, let us mention our first killer, which is noteworthy for understanding the interplay between my four charts.
The massive divergence that has developed between real rates and gold suggests that gold could be very strong over the longer term, or interest rates must rally. Or, as I believe, both. I believed that higher rates is a temporary depressant for gold, so the market can take negative cues from the action of gold, whether it goes up or down.
However, narratives that magically become short-term drivers dissipate. Writers on this site have intelligently looked at the divergence between long-term yields and inflation. So, I wish to look at some supporting evidence for the preceding conclusion.
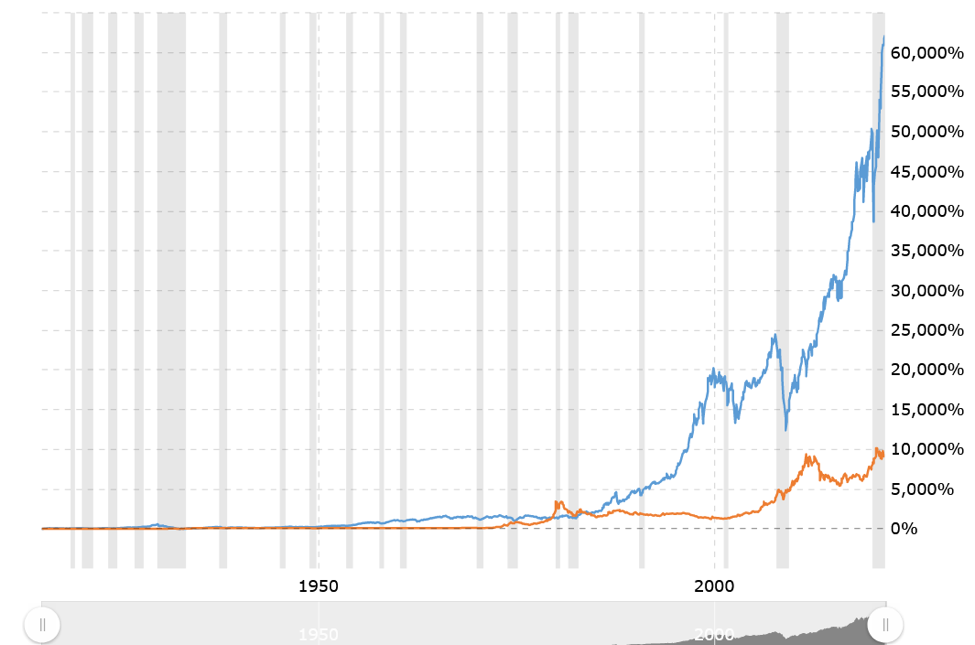
Gold Price Versus Stock Market – 100 Year Chart
This chart compares the historical percentage return for the Dow Jones Industrial Average against the return for gold prices over the last 100 years.
Note: The grey-shaded areas indicate recessions.
This report agrees with the chart’s designation for the period as being recessionary, despite the favorable numbers that have come out on the U.S. economy. This is due to my stance that it is wise to look at the two years 2020-2021 as a single period due to the unusual circumstances created by COVID-19. Moreover, the extraordinary measures of extreme stimulus skew how one is to interpret real economic growth.
The spread between 10-year interest rates and the inflation rate is about 4%. Even more important than the size of this spread is the fact that they have trended together, whatever the spread was at the time. Now, however, they have diverged in a major way.
The inflation rate has erupted, while 10-year rates actually ticked down. The spread is absolutely unsustainable and joins the 100-year study of the stock market versus gold (above) in corroborating that the sundry divergences must narrow or even disappear.
To simply look at a forecast for interest rates without actually looking at the bigger picture (long-term charts of related study) is so myopically foolish that one must consider that perhaps it is only the “wisely myopic” day-traders who are guessing at what the rest of the market is looking at on that day. (If so, that in itself explains all that we need to know.)
Gold has gotten hit because of the story that rates have bottomed and that the U.S. dollar must, therefore, rally. Never mind endless printing or, and more importantly, the outrageous divergences that suggest that there is plenty of room for gap-closing, while still maintaining the underlying trend.
Put another way, and as we see from the above chart, gold could easily rally to $3,000+ and have rates ticking up. Inflation has spiked worse than people know, despite experiencing the effects.
Since higher rates represent death for the stock market longer term, then shouldn’t the drop in gold, which is supposedly falling due to a presumed bottom of rates, be totally out of whack? Shouldn’t the reason for falling gold prices actually be an even greater reason for the market to go down? Yet, it rallies.
The narrative today is illogical.
Illogic takes a back seat to irrationalism, however, when we realize that there is no historical precedence for an explosive new high even as the economy is in recession.
Great earnings that are partly due to selective comparisons (if 2020 was an anomaly, must 2021 not be deemed to be an anomaly as well, for comparison purposes?) mask the fact that U.S. citizens are spending what was just handed to them as a result of the printing presses.
Growth by printing does more for stock prices that it does for the economy, though the latter is indeed a major benefactor.
2-Year Nikkei Chart
This is merely a technical point, for which I go back to my old stomping ground – the Nikkei.
The Nikkei peaked in February and, ultimately, I have found that they trend together, even if with slight delays and a widening gap in the value between the Dow and the Nikkei.
For those who are waiting to call a perfect Dow summit, perhaps a clue could be found on the day that the Nikkei breaks above the February peak by even a point.
12-Year Dow Chart
The post-2008 Dow chart below illustrates the greater nosebleed within which today’s intermediate-term nosebleed charts find themselves. It also illustrates an expanding triangle, the meaning and translation of which is mounting volatility!
Firstly, when one looks at 1-year charts of the U.S. indices (not shown), we see that the rallies since the 2020 low have taken the form of a-b-c patterns (to conclude Wave-B). This would suggest that the next move will be Wave-C (“A” was the 2020 debacle).
This type of Wave-C pattern, which follows a Wave-B that made new all-time highs, is necessarily violent as regards the speed with which it occurs.
Here, I would like to again refer to the unprecedented chart (first graph) that illustrates the violence of the stock market’s up-move within a recession!
That chart served to make the argument that an unspeakably irrational 5th-wave is under way, as the 2020 bottom constituted a Wave-4 low.
An expanding triangle, according to the rules that define them, has 5 points (which is then followed by a countertrend rally that, after a substantial move up, dives into a longer term bear market).
If the Dow is completing Wave-5 within its 12-year pattern, it would be coinciding with the 4th point of the expanding triangle.
The upshot is this:
In the case of an expanding triangle, point-#5 must be lower than point-#3, even if it is only by a single point.
If the market is simply peaking this year within a ~12-year 5-wave movement, then, per Elliott Wave Theory, the next significant drop would be to the area of the preceding 4th-wave.
The Dow, therefore, is peaking within (1) a long-term Wave-5, or (2) a B-Wave within an A-B-C pattern, or (3) point #5 within a two-year expanding triangle. In conclusion, the next bear could drag the index to the 17,500 – 20,500 area.
Will the headlines be about more “pandemic?” Will it be about deepening problems related to the Chinese? Or, as I believe, will it simply be about deleveraging as the market comes to focus on the fact that PEs are out of whack with growth rates.
Understandably, of course, the media would find that to be a boring storyline for day-to-day business.
CNN Fear & Greed Index: A Barometer of Sentiment
A sentiment barometer can also be thought of as a gauge for buying power. In the case of short term sentiment indicators, such as the CNN Fear & Greed Index (below), reflect what investors have already done.
To consider the simplest example, if everyone in the elevator or at the water-cooler is extremely bullish about the stock market at, say, a cyclical peak, it means, and is because of the fact that everyone is making money.
Simply, no one is losing money (assuming that their stocks are matching the index), so, obviously, all of the mavens are happy.
Without looking at the seven indicators upon which the gauge below is based, we see that the market actually dipped into “extreme fear” a week ago. It can still fall below 25 again to deepen the reading in creating a short-to-intermediate term buy signal, but a cross above 50 would confirm that the signal has already arrived.
Be wary, however, the chart below the barometer also suggests that that swings to “extreme greed” could also happen violently.
With respect to such a potentially violent swing, I refer back to the enormous upward spike in the 100-year chart comparing the Dow and gold. That technical study clearly shows that this upward spike has occurred during a recession; we see no historical precedent for such a nosebleed chart!
Still, such a sentiment reversal would customarily buy the bulls a few months. The problem is the word, “customarily.”
The key for investors is to simply note that there are too many potential storylines to rationalize a bear market, including ones that have not even been thought of yet.
As explained in the first section, the market will peak all right, but the bears might have died first (i.e. broke). Having learned this from my mentor 40 years ago, and having seen this phenomenon at work over that time period, for the past two years (August 2019 – August 2021) I have only recommended structuring a strategy that is geared to offer downside leverage, while providing ongoing income via the sale of weekly puts. This latter aspect is integral to the strategy, and turns an otherwise painful experience into a rather tolerable one.
Three notable reports I wrote in 2007 (July 7, October 7, December 2) identified key peaks. If one did not trade, however, the first two of those three reports would have left one the poorer. The 3rd was the charm, bearing the title, “2008 Dow Crash.”
It is natural human behavior to fear “missing it,” but, in that case, either have a great strategy – or really deep pockets.
Still, while my mentor was of the school that it is better to be lucky than wise, I have not followed in his fashion of humility. Rather, I believe in structuring a strategy that could be poised to benefit from the actualization of one’s bearish views, while not being inordinately punished during the sometimes-extended waiting period that one must endure before being redeemed.
Otherwise, the market can vindicate an investor, but only after having killed him first.
Trading in financial instruments and/or cryptocurrencies involves high risks including the risk of losing some, or all, of your investment amount, and may not be suitable for all investors. Prices of cryptocurrencies are extremely volatile and may be affected by external factors such as financial, regulatory or political events. Trading on margin increases the financial risks.
Before deciding to trade in financial instrument or cryptocurrencies you should be fully informed of the risks and costs associated with trading the financial markets, carefully consider your investment objectives, level of experience, and risk appetite, and seek professional advice where needed.
Fusion Media would like to remind you that the data contained in this website is not necessarily real-time nor accurate. The data and prices on the website are not necessarily provided by any market or exchange, but may be provided by market makers, and so prices may not be accurate and may differ from the actual price at any given market, meaning prices are indicative and not appropriate for trading purposes. Fusion Media and any provider of the data contained in this website will not accept liability for any loss or damage as a result of your trading, or your reliance on the information contained within this website.
It is prohibited to use, store, reproduce, display, modify, transmit or distribute the data contained in this website without the explicit prior written permission of Fusion Media and/or the data provider. All intellectual property rights are reserved by the providers and/or the exchange providing the data contained in this website.
Fusion Media may be compensated by the advertisers that appear on the website, based on your interaction with the advertisements or advertisers.