Dow Jones: Value Stocks Do Not Provide a Safe-Haven Refuge
MarketPulse | Apr 22, 2025 07:08AM ET
- The recent sell-off in major US stock indices has been largely driven by broader macroeconomic factors.
- Value stocks may not be able to provide a hedge against undiversifiable risks.
- A further bear steepening of the US Treasury yield (10-year minus 2-year) with rising stagflation risk may trigger a negative feedback loop into the DJIA.
- Watch the 36,300 key intermediate support of the DJIA.
This is a follow-up analysis of our prior report on a related major US stock index “Nasdaq 100 Technical Outlook: 12% monster rally may be a bull trap” dated 10 April.
Since our last publication, the Nasdaq 100 CFD Index (a proxy for the Nasdaq 100 E-mini futures) has staged a bearish reaction after a retest of its 20-day moving average and shed 8.7% to print an intraday low of 17,592 on Monday, 21 Monday.
In comparison, the US Wall Street 30 CFD Index (a proxy of the Dow Jones Industrial Average futures), which has lesser weightage towards technology and Artificial Intelligence (AI) stocks, has also tumbled over the same period, albeit a slightly smaller loss of 7.7%
Macro Factor Is Now a More Significant Driver for US Stock Market Performance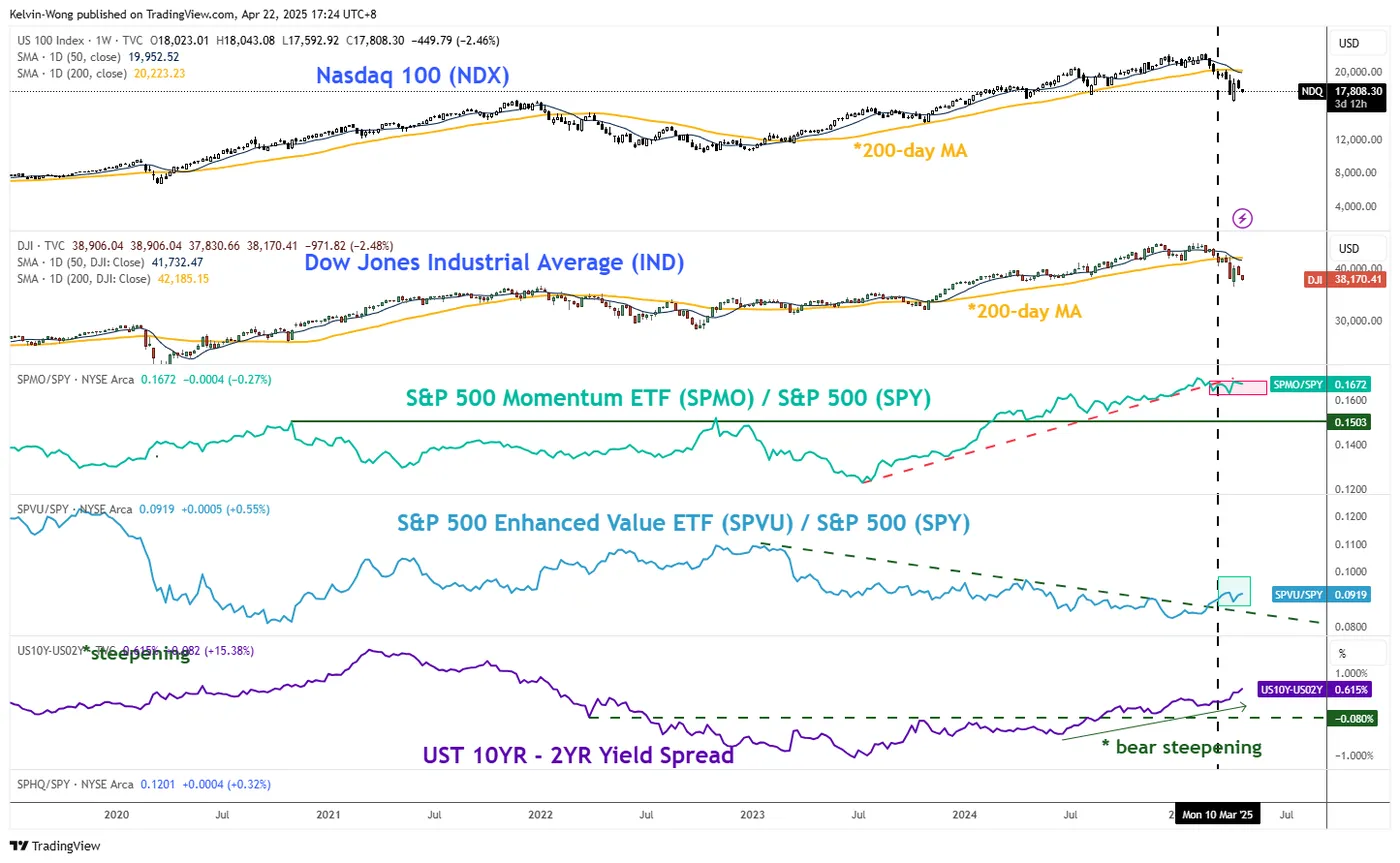
Source: TradingView
Fig 1: Nasdaq 100, DJIA, momentum, value factors, US Treasury yield curve major trends as of 22 Apr 2025
The prior medium-term uptrend phase of the Nasdaq 100 from August 2024 to February 2025 has been supported by the momentum factor of the US stock market. This finding can be seen by plotting a relative strength (ratio chart) of the S&P 500 momentum exchange-traded fund (ETF) over the mega-cap weighted S&P 500 ETF
The prior outperformance of the S&P 500 momentum ETF over the S&P 500 ETF was depicted by its rising ratio chart that moved in direct tandem with the Nasdaq 100’s medium-term trend phase from August 2024 to February 2025.
On the week of 10 March 2025, the outperformance of the S&P 500 momentum ETF had started to dwindle as its ratio chart against the S&P 500 ETF had rolled under its former key ascending support, which in turn, saw the Nasdaq 100 tumble below its key 200-day moving average.
In contrast, over the same period (the week of 10 March), the value factor of the US stock market started to outperform, as depicted by the relative strength (ratio chart) of the S&P 500 momentum exchange-traded fund (ETF) over the S&P 500 ETF broke above its former key descending resistance (see Fig 1).
The Dow Jones Industrial Average tends to be viewed as a more “value-oriented” barometer benchmark US stock index due to its higher weightage of value-related sectors, such as Financials and Health, over the Nasdaq 100; these two sectors have a combined weightage of close to 40%.
However, the value factor has failed to propel up the Dow Jones Industrial Average as it has moved in direct synchronisation with the bearish movement inflicted on the Nasdaq 100, as it too broke below its key 200-day moving average on the week of 10 March and continued to trade below it at this time of writing.
The main driver of the Dow Jones Industrial Average at this juncture seems to be dictated by the macro factors (undiversifiable risks), where the US Treasury yield curve (10-year yield minus 2-year yield) has shaped a bear steepening movement.
The steepening of the US Treasury yield has been driven by the 10-year US Treasury yield, which rose by 21 basis points (bps) from the week of 10 March till today, and in comparison, the 2-year US Treasury yield has fallen by 24 bps.
The current bear steepening of the US Treasury yield curve is a negative signal for the broader US stock market, especially when viewed in the context of recent economic indicators. Preliminary data from the University of Michigan’s Consumer Sentiment and Inflation Expectations for April point to rising stagflation risks, characterized by slowing growth alongside persistent inflation. A continued steepening of the yield curve suggests a higher cost of funding, which, combined with weaker growth prospects, could weigh heavily on corporate earnings in the coming quarters.
DJIA at Risk of Breaking Its Key Support at 36,300
Source: TradingView
Fig 2: US Wall Street 30 CFD long-term & major trends as of 23 Apr 2025
In the past week, the price actions of the US Wall Street 30 CFD Index (a proxy of the Dow Jones Industrial Average futures) have almost wiped out 80% of the gains triggered by US President Trump’s early announcement of the 90-day pause on the higher US reciprocal tariffs rates on 9 March.
The US Wall Street 30 CFD Index has slipped by 5.7% since the week of 14 April, coupled with a bearish momentum condition reading seen on its weekly RSI momentum indicator as it shaped a “lower high” below its 50 level and has not reached its oversold region (see Fig 2).
Watch the key intermediate support at 36,300 (also close to the long-term secular ascending channel support from the 23 March 2020 low), a break with a weekly close below it may trigger the start of a potential multi-month major downtrend phase to expose the next medium-term supports at 34,010 and 31,810 in the first step.
On the other hand, a clearance above 42,080 key medium-term pivotal resistance invalidates the bearish scenario to see a squeeze to retest the 45,150/45,475 long-term pivotal resistance zone.
Original Post
Trading in financial instruments and/or cryptocurrencies involves high risks including the risk of losing some, or all, of your investment amount, and may not be suitable for all investors. Prices of cryptocurrencies are extremely volatile and may be affected by external factors such as financial, regulatory or political events. Trading on margin increases the financial risks.
Before deciding to trade in financial instrument or cryptocurrencies you should be fully informed of the risks and costs associated with trading the financial markets, carefully consider your investment objectives, level of experience, and risk appetite, and seek professional advice where needed.
Fusion Media would like to remind you that the data contained in this website is not necessarily real-time nor accurate. The data and prices on the website are not necessarily provided by any market or exchange, but may be provided by market makers, and so prices may not be accurate and may differ from the actual price at any given market, meaning prices are indicative and not appropriate for trading purposes. Fusion Media and any provider of the data contained in this website will not accept liability for any loss or damage as a result of your trading, or your reliance on the information contained within this website.
It is prohibited to use, store, reproduce, display, modify, transmit or distribute the data contained in this website without the explicit prior written permission of Fusion Media and/or the data provider. All intellectual property rights are reserved by the providers and/or the exchange providing the data contained in this website.
Fusion Media may be compensated by the advertisers that appear on the website, based on your interaction with the advertisements or advertisers.