Dow And Silver Turning Points
Sid Klein | Oct 25, 2021 01:12AM ET
The Dow and silver turning points have occurred, based on the analyses and clear Elliott Wave annotations and interpretations found in last month’s report,“ Dow And Silver Trust’s March To Inevitability."
Any short term catch-up in the NASDAQ that would hold up the Dow through month-end would be as insignificant as a possible iShares Silver Trust (NYSE:SLV) retest of the $20 area. In neither case would strategy be affected.
While the un-annotated charts below update those from last month, September’s chart annotations illustrate why I believe we have indeed arrived at major turning points. Last month’s clear wave counts imply the interpretations found in both reports.
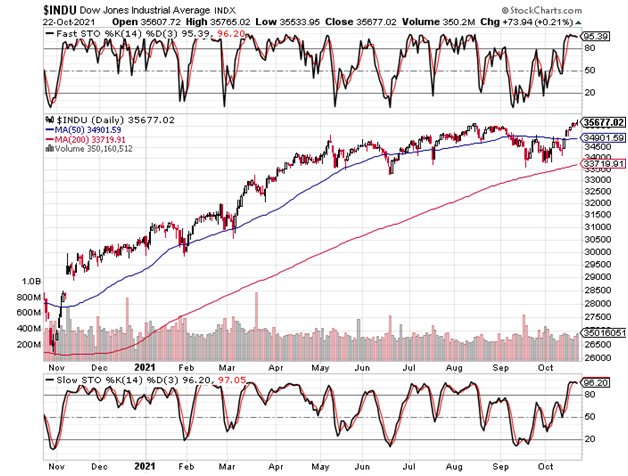
DOW
In the case of the DOW or S&P strategy, since August 2019, I have advocated an income-generating program that would benefit from the time-consuming rallies that are typical of bear markets, while being simultaneously positioned for leveraged gains in the event of sharp quarterly declines.
As regards my present market view, last month’s report illustrated the ideal scenario for which to be prepared:
“The proximity to the 200-day moving average and the stochastic divergence are plain and clear evidence of a correction of some sort having ended.
“Disconcerting aspects, however, are found in the speed with which the stochastic is advancing toward overbought and, even more ominously, the equally plain and clear dome formation of the top that has been developing since June.
“This means that short sellers can use tight stops, if fading new highs that could result from manipulation that seeks to drag the last dollar and the last short coverer into the market.”
The updated 1-year daily chart appears below. While it is noteworthy that the secularly bearish interpretation continues to play out perfectly, it is critical to understand that divergences in the daily charts have not yet manifested.
That fact would support a decline and rally back to overbought, though to lower slow stochastic levels that are concurrent with a final high in the Dow (once again by a hair). The latter observation must be taken-in, along with the weekly chart (second chart below) that has already provided the bearish divergence.
Still, the 200-day MA and slow stochastic have more logical applications for the short term, for the reasons explained in the past. All-in-all, then, we must comfortably fall back on the preferred strategy; this allows for being positioned, without needing to be perfect and risk missing the next major decline.
I again call attention to the 2007 peak; this scenario would be perfectly in-line with the scenario discussed above, which contemplates a minor new high that would follow a short term decline.
From the Aug. 11, 2021 report:
“Three notable reports I wrote in 2007 (July 7, October 7, December 2) identified key peaks. If one did not trade, however, the first two of those three reports would have left one the poorer. The 3rd was the charm, bearing the title, ‘2008 Dow Crash’.”
Again from the September report:
“The 5-year Dow weekly chart appears below. Beware.
“In contrast to the daily chart above which gave a bullish buy signal divergence that crossed over 20, this weekly chart shows a clear and evident sell signal by way of its negative divergence that led to a break below 80!”
“Conflicting signals are consistent with the Dow’s dome formation that is forming and preparing to roll over and fall out of bed, with a floor far below around 18,000.”
CNN Fear & Greed Index
Again from last month’s report:
“A spike flush-out, as what we just saw, was perfectly consistent with the Dow charts. The “Extreme Fear” reading (below 20) that had already been achieved suggested that a new spike low was already being discounted.
“Will a minor new high in the Dow coincide with a reading in the “Extreme Greed” zone (above 80)?”
As we can see below, a continuation of the spike to 80+ could be completed by month-end (this week). As previously cautioned, though a low in “extreme greed” may have been (and indeed was) achieved, the spike to “extreme greed” could be swift.
Be ready, then, for a key data point within the unfolding major historic turning point in the stock market.
iShares Silver Trust
Sept. 27, 2021 report:
“The 3-year iShares Silver Trust (SLV) weekly chart appears below. My interpretation of the price action since the 2020 bottom at $11 is that the “orthodox low” was put-in at $14, while the subsequent Wave-1 peak concluded at $27 in August 2020.”
Last month’s annotations on the 3 and 11-year charts suggested the possibility of a perfect low. An updated but un-annotated version of the latter is linked here . The updated but un-annotated 3-year chart appears below.
The type of chart in the preceding paragraph gives a very clear look at the critical importance of the $20 level that has been repeatedly seen since 2006, either as resistance or support. Coupled with last month’s annotations, we can easily see why $44 is indeed a very reasonable forecast for the next major cyclical rest area.
Past reports have examined overlay charts of silver versus gold to display the meaningful potential for silver to play fast and substantial catch-up to its big brother. Since silver doubles as a precious metal as well as an industrial one, the overlay chart of silver versus copper since 2008 (courtesy of Refinitiv, immediately below) serves as corroboration of silver’s exciting potential.
Today’s conclusion is unchanged from the previous two months, though the strategy update follows.
From the August 11, 2021 report:
“For speculators, the January 20, 2023 $28-strike calls closed yesterday with a bid-ask of $2.43 – $2.48. In the event of a longer consolidation period, I would advise a more aggressive stance at the next entry point.”
From the September 27, 2021 report:
“The option advised for speculators has fallen to $1.31 - $1.35, and I do indeed advise a more aggressive stance as discussed in the preceding paragraph.”
If so inclined, one may add to the position at month-end, this week. If the week moves even 50 cents higher from Friday’s close over the coming 5 days, one can simply hold off from adding.
Ordinarily, this is not the time to add to long positions, cyclically-speaking. Cycle inversions, however, can occur when markets arrive at major turning points. These are NOT ordinary times, so one must contemplate what may occur during such periods.
Original Post
Trading in financial instruments and/or cryptocurrencies involves high risks including the risk of losing some, or all, of your investment amount, and may not be suitable for all investors. Prices of cryptocurrencies are extremely volatile and may be affected by external factors such as financial, regulatory or political events. Trading on margin increases the financial risks.
Before deciding to trade in financial instrument or cryptocurrencies you should be fully informed of the risks and costs associated with trading the financial markets, carefully consider your investment objectives, level of experience, and risk appetite, and seek professional advice where needed.
Fusion Media would like to remind you that the data contained in this website is not necessarily real-time nor accurate. The data and prices on the website are not necessarily provided by any market or exchange, but may be provided by market makers, and so prices may not be accurate and may differ from the actual price at any given market, meaning prices are indicative and not appropriate for trading purposes. Fusion Media and any provider of the data contained in this website will not accept liability for any loss or damage as a result of your trading, or your reliance on the information contained within this website.
It is prohibited to use, store, reproduce, display, modify, transmit or distribute the data contained in this website without the explicit prior written permission of Fusion Media and/or the data provider. All intellectual property rights are reserved by the providers and/or the exchange providing the data contained in this website.
Fusion Media may be compensated by the advertisers that appear on the website, based on your interaction with the advertisements or advertisers.