Dollar Topped, Yen Bottomed As Sentiments
ActionForex | Dec 15, 2014 01:56AM ET
Sentiments seemed to have turned rather bad in the financial markets last week. DJIA suffered the biggest weekly drop in three years as dragged down by the steep fall in crude oil and worry over China's economy. DJIA ended down -678pts, or -3.8% to close at 17280.83. S&P 500 also tumbled -73pts, or -3.5% to close at 2002.33. WTI crude oil closed below 60 level for the first time since 2009, at 57.49, and it was above 100 level back in July. Treasury yields also suffered steep decline with 30 year yield closing at 2.7566, comparing with prior week's close of 2.964. In the currency markets, Aussie and Loonie were hardest hit while the Japanese yen recovered on risk aversion, ahead of Japan's snap election this weekend. Overall volatility could continue to increase when markets get thinner as holiday approaches.
There are two important developments to note in the currency markets. Firstly, it's getting more likely that the greenback has topped out, at least in near term against European majors. Both euro and swiss franc recovered strongly against the dollar. Bearish divergence conditions are seen in the daily MACD of EUR/USD and GBP/USD Meanwhile, bearish divergence condition is seen in daily MACD of USD/CHF. Key levels to watch for in near term include 1.2599 in EUR/USD, 0.9529 in USD/CHF and 1.5825 in GBP/USD. Break of these level could trigger even deeper pull back in dollar.
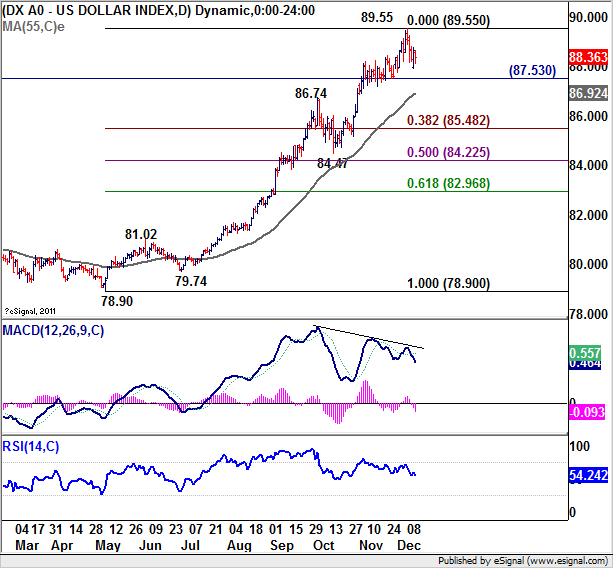
Also, it looks like that the dollar index could have topped in medium term at 89.55, inside key long term resistance zone of 88.70/89.62. This is supported by bearish divergence condition in daily MACD. Near term focus is back on 87.53 support. Break will confirm this bearish case and would bring deeper pull back to 84.47/86.74 resistance zone.

Secondly, the Japanese yen has likely bottomed at least in near term. We saw USD/JPY, EUR/JPY and GBP/JPY topped at 121.84, 149.76 and 189.70 already. And more corrective trading should be seen in near term to drag down the yen crosses. At this point, we're expecting support from 115.47, 142.08 and 181.09 to contained downside in these corrections and bring rebound. But the situation could be heavily influenced by risk sentiments and treasury yields.
While the long term up trend in DJIA is still intact, we might indeed see a period of correction in near term first. The firm break of 55 days EMA is certainly a sign of weakness. But the key would lie in 38.2% retracement of 15855.12 to 17991.18 at 17175.20 this week. Strong support from this level would turn DJIA into sideway trading and that could give some support to yen crosses for recovery. However, firm break of this fibonacci level would likely drag DJIA deeper to 61.8% retracement at 16671.09 and take yen crosses down with it.
Regarding trading strategies, our USD/CAD and EUR/AUD long yield positive results last week. Momentum in both crosses was firm as seen in daily charts. Thus, we'd maintain these positions for another week and trail the stops. Stop in USD/CAD is moved up from 1.130 to 1.145. Stop is EUR/AUD moved up from from 1.146 to 1.149. The USD/JPY long was somewhat wrong as yen crosses tumbled on risk aversion. Current USD/JPY is supported above 117.23 support and there is prospect of a recovery. Thus, we'd place stop at 117.20 and see if there is a recovery to 120 handle to close the position with smaller loss.
Trading in financial instruments and/or cryptocurrencies involves high risks including the risk of losing some, or all, of your investment amount, and may not be suitable for all investors. Prices of cryptocurrencies are extremely volatile and may be affected by external factors such as financial, regulatory or political events. Trading on margin increases the financial risks.
Before deciding to trade in financial instrument or cryptocurrencies you should be fully informed of the risks and costs associated with trading the financial markets, carefully consider your investment objectives, level of experience, and risk appetite, and seek professional advice where needed.
Fusion Media would like to remind you that the data contained in this website is not necessarily real-time nor accurate. The data and prices on the website are not necessarily provided by any market or exchange, but may be provided by market makers, and so prices may not be accurate and may differ from the actual price at any given market, meaning prices are indicative and not appropriate for trading purposes. Fusion Media and any provider of the data contained in this website will not accept liability for any loss or damage as a result of your trading, or your reliance on the information contained within this website.
It is prohibited to use, store, reproduce, display, modify, transmit or distribute the data contained in this website without the explicit prior written permission of Fusion Media and/or the data provider. All intellectual property rights are reserved by the providers and/or the exchange providing the data contained in this website.
Fusion Media may be compensated by the advertisers that appear on the website, based on your interaction with the advertisements or advertisers.