Does The 200-Day Moving Average Still Matter?
David Fabian | Jan 09, 2017 12:56AM ET
Clients and readers often ask my opinion about an investment relative to its 200-day moving average. This trend line is one of the most common foundations of simple technical analysis.
In fact, the 200-day moving average has deep-rooted meaning to my family legacy. My grandfather Dick Fabian was one of the first investors to pioneer a trend following system based on this measurement.
Back in the late 1970’s, he noted the 40-week moving average (essentially 200 days) was an excellent buy and sell trigger for stocks. It was difficult to even get daily closing prices back then. He had to go back to the library and research all the week-ending data out of the newspaper just to compile the average. Then chart it on graph paper by hand.
He then used that research to found a very successful financial publication called Telephone Switch Newsletter that was based around this concept. Through the 1980s and 1990s, this system truly thrived. It got subscribers out the market before the 1987 crash and put up huge performance figures versus the S&P 500 and Wilshire 5000 Index.
Side note: the “telephone switch” moniker referenced how you went about making changes to your portfolio in those days. You would call your fund company or broker and ask them to “switch” you into ABC mutual fund or back to cash. Tough for young guys like me (I’m 35) to imagine. It probably cost a fortune as well.
Then something happened around the turn of the century. The 200-day moving average stopped becoming such a sound buy and sell trigger. It would often lead to false signals and fast reversals called whipsaws that caught investors off-guard.
At one point, long after he retired, my grandfather quietly conveyed to me that he had given up on the trend-following mantra he helped create. “The damn thing just doesn’t work anymore”, he explained.
Observations
Over the course of my career, I have spent hundreds of hours studying this metric. I’ve looked at the 200-day moving average across virtually all asset classes. I’ve looked at the absolute returns of buy and sell signals from the 200-day. I’ve looked at changing the triggers based on the slope of the 200-day. I’ve looked at adding bands around the 200-day to create guidelines for buying back in. I’ve looked at changing to an exponential moving average and the effect of dividends.
The results have been predictably mixed. You can create small improvements in the success rate with minor tweaks. However, over the last 10-15 years, it’s been little better than a coin flip in terms of “calling” a major turn. Often, it just makes you jump in and out of the market for little net gain and even miss a significant portion of certain moves.
I have a theory as to why this is. Look at how hard my grandfather had to work to generate his system. It was a concept that few had access to and even fewer took the time to utilize as a trading strategy. There was an arbitrage opportunity there that worked to his benefit.
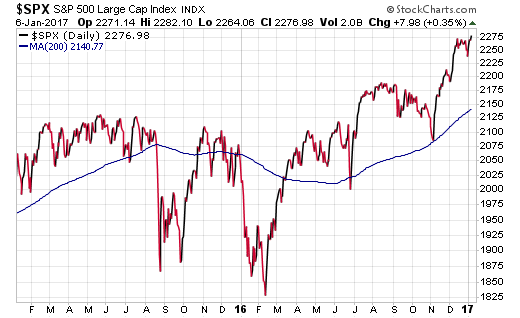
Now pull up literally any investment chart at any finance website. What’s the first thing you see? That smooth red trend line. It’s ubiquitous in today’s computer-driven technical analysis world. Everyone can see it, which leads to the indicator losing much of its mystical value as a trading arbitrage. The market is just as likely to ignore it as respect it based on support or resistance.
This sentiment towards the effectiveness of the 200-day simple moving average seems to be endorsed by Michael Harris in a recent interview by Forbes as well.
Implementation
The question now becomes – can investors still utilize the 200-day moving average even at a diminished capacity? I believe the answer is yes.
This trend line can still be used as supportive evidence of investments that are showing obvious signs of long-term up-trends or downtrends. It may also be part of an investors check list when deciding whether to enter or exit a position. For example:
- Does this stock or index fit within my current portfolio mix?
- Does it have a unique technical or fundamental value proposition?
- Is it trending above/below its 200-day moving average?
Notice how it’s just one factor of many in the investment decision process. In my opinion, the 200-day should not be THE ONLY deciding factor to base buy and sell signals on. That is the key distinction from my real-world experience as a portfolio manager.
It’s also difficult to incorporate this trend following methodology within the context of a multi-asset portfolio . The whole point of diversification is that some investments are going to be moving in one direction, while others consolidate or move in a different direction. You can’t possibly use the 200-day as a buy/sell signal for stocks AND bonds because you will constantly be flipping in and out of both asset classes.
Lastly, by its nature, the trend line is very slow to change its direction and slope. This makes it an extremely poor trigger during volatile markets. It won’t get you out near the top and it won’t get you in near the bottom. If the current price of the S&P 500 Index is 8% below the 200-day moving average, and you think it’s going to rebound, do you want to wait for it to move up 8% to buy?
Just look at the most recent examples of late-2015 and early-2016 for evidence of this folly.
The Bottom Line
Advantages in the investment world are often quick to be discovered and exploited by the masses. Even if a method appears to have a significant edge, it is often diminished through time and technology. Investors would be wise to keep this in mind whenever a new strategy is introduced with promises of amazing returns or risk aversion.
Disclosure: FMD Capital Management, its executives, and/or its clients June hold positions in the ETFs, mutual funds or any investment asset mentioned in this article. The commentary does not constitute individualized investment advice. The opinions offered herein are not personalized recommendations to buy, sell or hold securities.
Trading in financial instruments and/or cryptocurrencies involves high risks including the risk of losing some, or all, of your investment amount, and may not be suitable for all investors. Prices of cryptocurrencies are extremely volatile and may be affected by external factors such as financial, regulatory or political events. Trading on margin increases the financial risks.
Before deciding to trade in financial instrument or cryptocurrencies you should be fully informed of the risks and costs associated with trading the financial markets, carefully consider your investment objectives, level of experience, and risk appetite, and seek professional advice where needed.
Fusion Media would like to remind you that the data contained in this website is not necessarily real-time nor accurate. The data and prices on the website are not necessarily provided by any market or exchange, but may be provided by market makers, and so prices may not be accurate and may differ from the actual price at any given market, meaning prices are indicative and not appropriate for trading purposes. Fusion Media and any provider of the data contained in this website will not accept liability for any loss or damage as a result of your trading, or your reliance on the information contained within this website.
It is prohibited to use, store, reproduce, display, modify, transmit or distribute the data contained in this website without the explicit prior written permission of Fusion Media and/or the data provider. All intellectual property rights are reserved by the providers and/or the exchange providing the data contained in this website.
Fusion Media may be compensated by the advertisers that appear on the website, based on your interaction with the advertisements or advertisers.