Do You Know Where Your Strategy Performance Is Coming From?
James Picerno | Feb 18, 2022 04:34PM ET
It’s a simple question with a simple answer, but it’s still easy to get sidetracked with misguided analytics. Fortunately, there’s a straightforward solution.
The proper way to decompose returns is by first recognizing that asset allocation usually plays a big role in driving results. A simple example: an equities-only portfolio will likely outperform an equal-weight mix of stocks and bonds in the long run. The main reason, sometimes the only reason: the asset allocation beta in the 100% equities portfolio has a higher risk profile vs. the 50/50 stocks/bond strategy.
If the equities-only portfolio generates an 8% annualized total return vs. 5% for the 50/50 strategy, the additional 3 percentage points in the former can be thought of as asset allocation beta. In other words, by changing the asset allocation (removing bonds and raising exposure to stocks), the equities-only strategy has earned a higher return by piggybacking on the higher performance of a specific asset class. This isn’t alpha since anyone can tap into the results with a forecast-free/analysis-free portfolio change.
So, where does genuine alpha come into play? Let’s run a simple example as an illustration. Imagine you’re considering a 60/40 stock/bond strategy as an investment. A fast-talking money manager comes along and pitches an alternative, with rules as follows:
When the growth-factor slice of the equities market outperforms the value component, the 60% allocation to the overall stock market — SPDR S&P 500 ETF (NYSE:SPY) — is shifted to a growth fund: SPDR Portfolio S&P 500 Growth ETF (NYSE:SPYG). If growth is underperforming, SPY is used for the equity allocation. In either case, a 40% allocation to maintained via iShares Core U.S. Aggregate Bond ETF (NYSE:AGG). (Note: in this toy example I’m using SPYG and SPDR Portfolio S&P 500 Value ETF (NYSE:SPYV) to generate the tactical signal.)
As it turns out, the tactical strategy of shifting between SPY and SPYG outperformed the standard 60/40 mix since 2015. The manager presents the chart below and declares himself a genius. He concludes by noting that his strategy outperformed with a 10.7% annualized total return vs. roughly 9.0% for the 60/40 portfolio. That’s 170 additional basis points of performance, he gleefully notes.
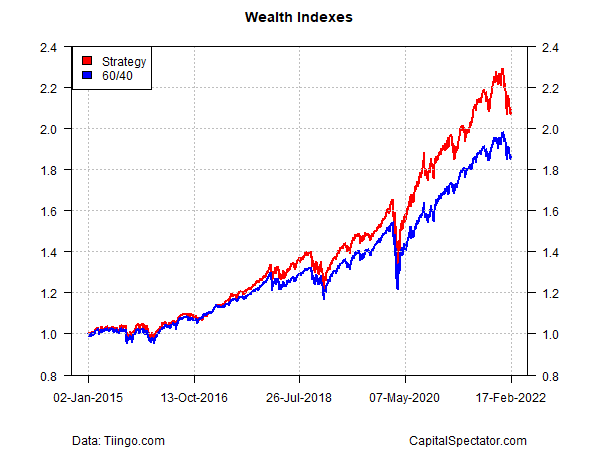
Not so fast, you counter, and proceed to point out that some of the additional return is linked to asset allocation beta. To be precise, by naively splitting the allocation to the two stock funds – 30% in SPY and 30% in SPYG – and pairing it with a 40% bond allocation, there was an improvement over the 60/40 return without using a tactical signal: the asset allocation beta mix earned 9.9%. (Note: all results are rebalanced to target weights at the end of each calendar year.)
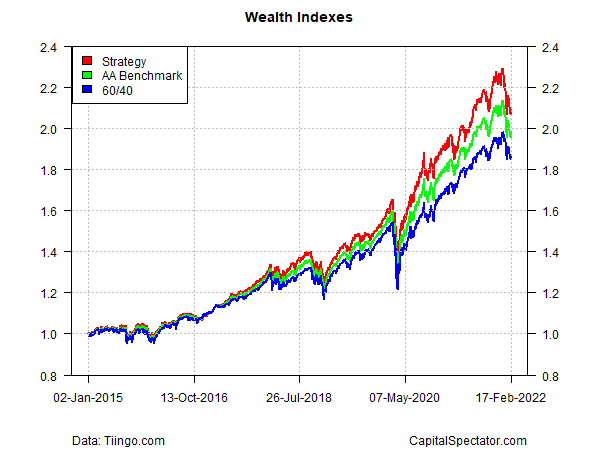
If we decompose the strategy’s 10.7% total return (or the equivalent of 1073 basis points) it becomes clear that about half of what the manager is describing as alpha is really just asset allocation beta. That is, the extra return from simply holding the opportunity set with a 30%/30%/40% target mix via three ETFs in this case: SPY, SPYG and AGG.
What can you do with this information? You might ask yourself if the extra ~85 basis points of genuine alpha is worth the risk of the manager’s tactical model? No model is perfect and so it’s crucial to understand how the model works and decide if you’re comfortable with its logic and the possibility that it could deliver negative alpha at some point.
Indeed, you might decide that the asset allocation alpha is more reliable, in part because it requires no special skill or talent to generate.
The larger point is that every active strategy has an asset allocation beta counterpart based on a passive mix of the opportunity set. Depending on a strategy, trying to enhance asset allocation beta with an active strategy may or may not be prudent. The first step is decomposing a strategy’s total return into its constituent parts.
Trading in financial instruments and/or cryptocurrencies involves high risks including the risk of losing some, or all, of your investment amount, and may not be suitable for all investors. Prices of cryptocurrencies are extremely volatile and may be affected by external factors such as financial, regulatory or political events. Trading on margin increases the financial risks.
Before deciding to trade in financial instrument or cryptocurrencies you should be fully informed of the risks and costs associated with trading the financial markets, carefully consider your investment objectives, level of experience, and risk appetite, and seek professional advice where needed.
Fusion Media would like to remind you that the data contained in this website is not necessarily real-time nor accurate. The data and prices on the website are not necessarily provided by any market or exchange, but may be provided by market makers, and so prices may not be accurate and may differ from the actual price at any given market, meaning prices are indicative and not appropriate for trading purposes. Fusion Media and any provider of the data contained in this website will not accept liability for any loss or damage as a result of your trading, or your reliance on the information contained within this website.
It is prohibited to use, store, reproduce, display, modify, transmit or distribute the data contained in this website without the explicit prior written permission of Fusion Media and/or the data provider. All intellectual property rights are reserved by the providers and/or the exchange providing the data contained in this website.
Fusion Media may be compensated by the advertisers that appear on the website, based on your interaction with the advertisements or advertisers.