Dividend Yield Vs. Total Return: How Vanguard ETFs Measure Up
Tony Dong | May 02, 2025 01:43AM ET
A pet peeve of mine is that, as of May 2025, there still isn’t a single global dividend ETF that checks all the right boxes—low fees, broad diversification, and strong liquidity. It seems like a simple ask, but I’ve yet to find one that does it all.
So, for now, I’m sticking with the DIY approach. Today’s portfolio uses four Vanguard ETFs to build global dividend exposure: two focused on dividend growth and two on high yield, with one U.S. and one international option in each category.
The US Side
Half of the portfolio is allocated to two core U.S. dividend ETFs from Vanguard: Vanguard Dividend Appreciation ETF (NYSE:VIG) and Vanguard High Dividend Yield ETF (NYSE:VYM), with 25% assigned to each.
Right off the bat, both funds are impressively low cost. As passive index-tracking products, VYM carries a 0.06% expense ratio, while VIG recently dropped to 0.05%. That’s $6 and $5 annually on a $10,000 investment—hard to beat. Both also track well-constructed benchmarks with clearly defined methodologies.
VIG follows the S&P U.S. Dividend Growers Index, which requires a 10-year history of consecutive dividend increases. It further filters out the top 25% of highest-yielding stocks to avoid potential yield traps. The fund is market-cap weighted with a 4% cap on any individual holding, and REITs are excluded altogether.
VYM tracks the FTSE High Dividend Yield Index. It includes U.S. companies that rank above the 55th percentile for yield in its selection universe, again excluding REITs, and is also market-cap weighted.
At the moment, VYM offers a 30-day SEC yield of 2.67%, while VIG yields less at 1.73%, but unsurprisingly has stronger historical dividend growth rates.
The international Side
The remaining 50% of the portfolio is split evenly between Vanguard International High Dividend Yield ETF (NASDAQ:VYMI) and Vanguard International Dividend Appreciation ETF (NASDAQ:VIGI), with 25% allocated to each.
These international funds are slightly more expensive than their U.S. counterparts, which is typical for global equity ETFs. VIGI charges 0.10%, while VYMI comes in at 0.17%. Still, both remain competitively priced and offer well-defined strategies.
VIGI tracks the S&P Global Ex-U.S. Dividend Growers Index, which includes companies from both developed and emerging markets that have increased their dividends for at least seven consecutive years. Like VIG, it excludes REITs and removes the top 25% of yielders to avoid potential yield traps. The remaining stocks are market-cap weighted with a 4% cap per position.
VYMI, on the other hand, follows the FTSE All-World ex U.S. High Dividend Yield Index. It selects the top 50% of dividend-paying stocks in its universe based on forecasted 12-month yield, also excluding REITs. Unlike VIGI, it doesn’t apply screens for dividend growth or sustainability and uses straightforward market-cap weighting.
International stocks typically yield more than U.S. ones, and that’s reflected here. VYMI is the income leader, offering a 30-day SEC yield of 4.37%, while VIGI yields a more modest 1.93%
Putting the Portfolio Together
The portfolio is simple: 25% each to VIG, VYM, VIGI, VYMI rebalanced once a year. Right now, this four-ETF blend has a weighted average expense ratio of 0.095% and a weighted 30-day SEC yield of 2.68%.
However, a backtest against a 50/50 mix of Vanguard Total Stock Market ETF (NYSE:VTI) and Vanguard Total International Stock ETF (NASDAQ:VXUS) from 2016-03-02 to 2025-04-25 shows that this dividend-focused portfolio underperformed.
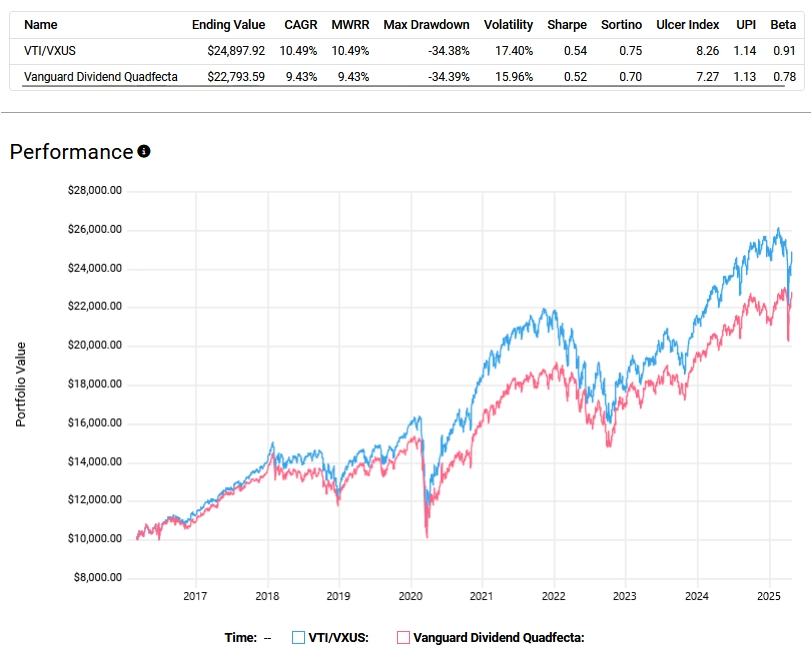
This portfolio delivered a compound annual growth rate (CAGR) of 9.43% compared to 10.49% for the total market blend. And remember, that’s before accounting for taxes on dividends—which would likely widen the gap further.
This highlights the key point: total return is what ultimately matters. Dividend ETFs often lag because of higher fees, more frequent distributions, and structural tilts.
That said, this portfolio could shine when value and quality factors are in favor. For instance, during 2020 through 2022, it saw smaller drawdowns compared to broader market portfolios.
In the end, you’ll have to decide whether the added complexity and costs are worth the psychological comfort of a higher yield and the intentional tilt toward dividend-paying, high-quality companies. If it helps you stay invested through volatility, that alone may be worth it.
Trading in financial instruments and/or cryptocurrencies involves high risks including the risk of losing some, or all, of your investment amount, and may not be suitable for all investors. Prices of cryptocurrencies are extremely volatile and may be affected by external factors such as financial, regulatory or political events. Trading on margin increases the financial risks.
Before deciding to trade in financial instrument or cryptocurrencies you should be fully informed of the risks and costs associated with trading the financial markets, carefully consider your investment objectives, level of experience, and risk appetite, and seek professional advice where needed.
Fusion Media would like to remind you that the data contained in this website is not necessarily real-time nor accurate. The data and prices on the website are not necessarily provided by any market or exchange, but may be provided by market makers, and so prices may not be accurate and may differ from the actual price at any given market, meaning prices are indicative and not appropriate for trading purposes. Fusion Media and any provider of the data contained in this website will not accept liability for any loss or damage as a result of your trading, or your reliance on the information contained within this website.
It is prohibited to use, store, reproduce, display, modify, transmit or distribute the data contained in this website without the explicit prior written permission of Fusion Media and/or the data provider. All intellectual property rights are reserved by the providers and/or the exchange providing the data contained in this website.
Fusion Media may be compensated by the advertisers that appear on the website, based on your interaction with the advertisements or advertisers.