Everything Going Right For Sherwin-Williams Now - So Wait To Buy
Sure Dividend | Oct 11, 2015 05:58AM ET
Sherwin-Williams (NYSE:SHW) was founded in 1866. The company has steadily grown since then through consolidating the United States coatings industry. Today, Sherwin-Williams has a market cap of $22.3 billion.
Sherwin-Williams operates in 4 groups. The percentage of total profit each group has generated through the first 6 months of fiscal 2015 is listed below:
- Paint Stores Group (68.6% of company profits)
- Consumers Group (19.1% of company profits)
- Global Finishes Group (10.8% of company profits)
- Latin America Coatings Group (1.5% of company profits)
The Paint Stores Group is by far the most important group for Sherwin-Williams. The Paint Stores Group operates the company’s 4,025 exclusive paint stores in the United States, Canada, and the Caribbean.
The Consumer Group sells the company’s products through various retailers in North America and Europe.
The Global Finishes Group sells a wide range of coating products for the following industries: industrial, marine, and automotive.
The Latin America Coatings Group generated just 1.5% of company profits through the first half of fiscal 2015. This Group sells coatings and finishes throughout Latin America.
Profit growth for each Group through the first 6 months of fiscal 2015 as compared to the first 6 months if fiscal 2014 is shown below:
- Paint Stores Group profits up 16.8%
- Consumers Group profits up 18.2%
- Global Finishes Group profits down 5.1%
- Latin America Coatings Group profits down 13.5%
On a constant currency basis, the Global Finishes Group profits would be up around 2.2%, and the Latin America Coatings Group profits would be up about 2.1%.
Even so, Sherwin-Williams North American operations are growing rapidly, while international operations are showing only very modest growth on a constant currency basis.
Sherwin-Williams strong competitive advantages are geographically concentrated in North America.
Sherwin-Williams’ Competitive Advantages
Sherwin-Williams is the third largest global coatings company.
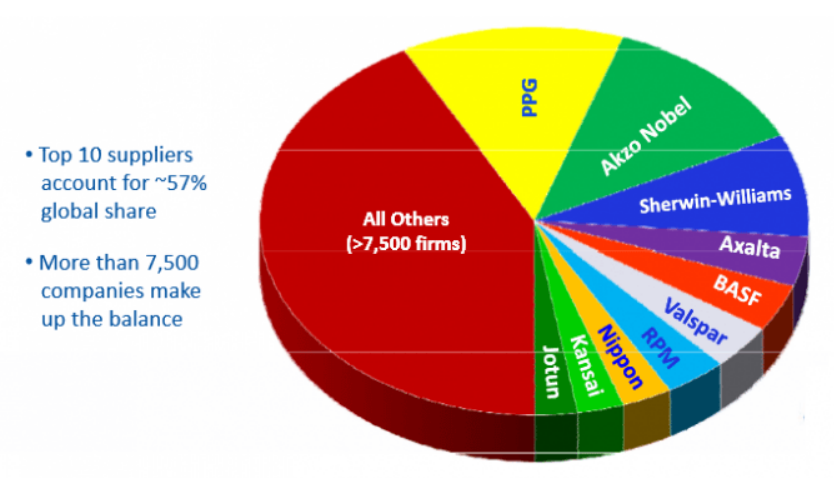
While that’s impressive, it also understates the company’s dominance in North America. Sherwin-Williams’ store count in the United States absolutely dwarfs its competitors. Over the last year alone, Sherwin-Williams has added 97 new stores in the United States… While all of its competitors combined have added 27 stores.
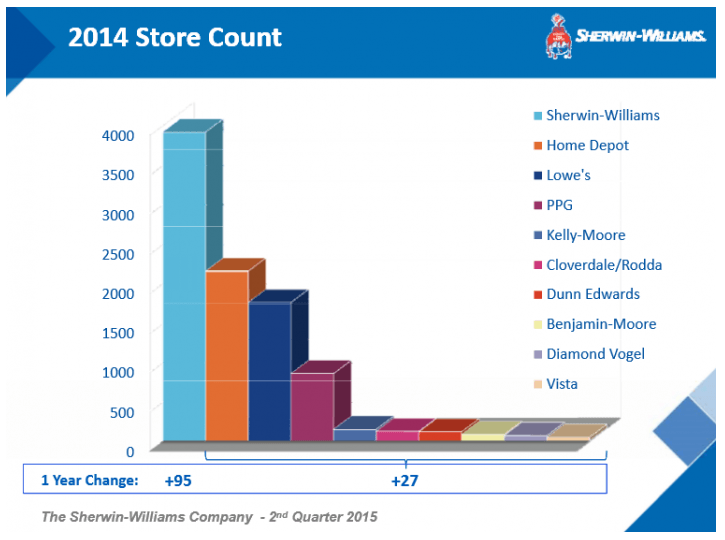
Sherwin-Williams is the undisputed leader in the United States paint industry. The company’s strength in the United States comes from its tremendous store count, excellent distribution network in North America, and well-known brands.
Sherwin-Williams strongest brands are shown in the image below:
In fiscal 2014, Sherwin-Williams spent $299 million on advertising, or 2.7% of total sales. The company’s large size and already established brands allows Sherwin-Williams to spend a relatively small percentage of total sales on advertising to maintain its brand strength.
Sherwin-Williams is the industry leader in the slow changing United States coatings industry. Paint is an industry that sees incremental change, but is unlikely to experience any breathtakingly rapid innovation that would threaten to unseat Sherwin-Williams. This fact should appeal to long-term investors.
Growth and Total Returns
Sherwin-Williams has grown both dividends and earnings-per-share at a compound rate of 11.6% a year over the last decade.
Much of this growth has come recently. In 2011, Sherwin-Williams had earnings-per-share of $4.14. The company had earnings-per-share of $8.78 in fiscal 2014 – more than doubling earnings-per-share in just 3 years!
The primary growth sources from 2011 through 2014 are shown below:
- Net profit margin increased 56% (from 5.0% to 7.8%)
- Revenue increased 27%
- Share count decreased 9%
As you can see, much of the company’s recent rapid growth is a result of tremendous margin improvements. Revenue has been growing at a good clip, but the real growth driver has been margin increases.
The question is… What is causing margins to soar?
Lower input costs are the primary driver of higher margins for Sherwin-Williams.
The two primary input costs for paint are oil and titanium dioxide. As is well known, oil prices have fallen precipitously over the last few years since highs in 2011. Metal prices have also fallen significantly since 2011. This has resulted in rising margins for Sherwin-Williams.
Another tailwind for the company (this one since 2009) is the resurgence of the United States housing industry brought around by ultra-low interest rates and a recovering economy.
Together, these two trends have created the perfect condition for Sherwin-Williams to grow its earnings.
Oil prices will not stay low forever. When they rise, Sherwin-Williams and its competitors will see margins fall.
This does not take away from Sherwin-Williams strong competitive advantages and market leading position in the United States, however.
Over a full economic cycle, Sherwin-Williams should realize earnings-per-share growth of between 8% and 12% a year. The company currently has a dividend yield of 1.1%. Shareholders of Sherwin-Williams can expect total returns of about 9% to 13% a year going forward.
Recession Performance
Sherwin-Williams business model is reliant upon the housing industry. When construction and housing are increasing, Sherwin-Williams thrives. The company sees falling earnings when the construction and housing industries falter.
The company’s earnings-per-share through the Great Recession and subsequent recovery are shown below to illustrate this point:
- 2007 earnings-per-share of $4.70 (high earnings mark at the time)
- 2008 earnings-per-share of $4.00 (decline due to start of recessions)
- 2009 earnings-per-share of $3.78 (recession low)
- 2010 earnings-per-share of $4.21 (partial recovery from recession)
- 2011 earnings-per-share of $4.14 (high oil prices reduce margins)
- 2012 earnings-per-share of $6.02 (new earnings high)
As you can see, it took Sherwin-Williams 3 full years to recover from 2009 recession lows. The company did remain profitable throughout, however. Recessions impact Sherwin-Williams profitability, but they do not put the company’s dividend in any real danger.
Valuation and Final Thoughts
Everything is going right for Sherwin-Williams right now. This means it is the wrong time to buy the stock. Sherwin-Williams had a dividend yield of well above 2% for much of 2008 through 2010. The company is currently about twice as expensive as it was during its slow-growth period.
Patient shareholders should wait until Sherwin-Williams stock offers investors yields above 2% before entering into a position in the stock. This won’t happen until one or both of the following occur: oil prices jump higher, or the housing and construction industries decline significantly.
Due to its current low dividend yield and relatively high valuation, Sherwin-Williams does not rank particularly high using The 8 Rules of Dividend Investing.
Still, Sherwin-Williams is a very high quality businesses with a long dividend history and strong competitive advantage in a slow changing industry. The company makes an excellent long-term holding in a dividend growth portfolio – now is just not the time to initiate or add to a position in the stock.
Trading in financial instruments and/or cryptocurrencies involves high risks including the risk of losing some, or all, of your investment amount, and may not be suitable for all investors. Prices of cryptocurrencies are extremely volatile and may be affected by external factors such as financial, regulatory or political events. Trading on margin increases the financial risks.
Before deciding to trade in financial instrument or cryptocurrencies you should be fully informed of the risks and costs associated with trading the financial markets, carefully consider your investment objectives, level of experience, and risk appetite, and seek professional advice where needed.
Fusion Media would like to remind you that the data contained in this website is not necessarily real-time nor accurate. The data and prices on the website are not necessarily provided by any market or exchange, but may be provided by market makers, and so prices may not be accurate and may differ from the actual price at any given market, meaning prices are indicative and not appropriate for trading purposes. Fusion Media and any provider of the data contained in this website will not accept liability for any loss or damage as a result of your trading, or your reliance on the information contained within this website.
It is prohibited to use, store, reproduce, display, modify, transmit or distribute the data contained in this website without the explicit prior written permission of Fusion Media and/or the data provider. All intellectual property rights are reserved by the providers and/or the exchange providing the data contained in this website.
Fusion Media may be compensated by the advertisers that appear on the website, based on your interaction with the advertisements or advertisers.