Did the Market Bottom or Just Bounce? Indicators You Should Watch
Geoff Bysshe | Mar 24, 2025 12:52AM ET
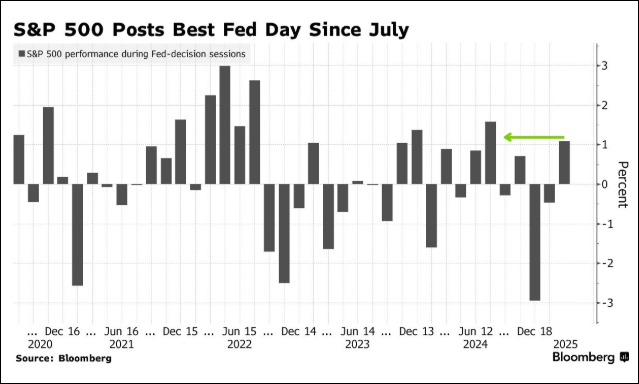
Last Wednesday, Fed Chair Powell delivered the best news he’s presented on a FOMC day since last July, as measured by the market’s reaction. This is illustrated in the chart below.
Was the Fed really bullish?
Interestingly, the data that the Fed presented wouldn’t normally be what you’d expect to spur both stocks and bonds to rally.
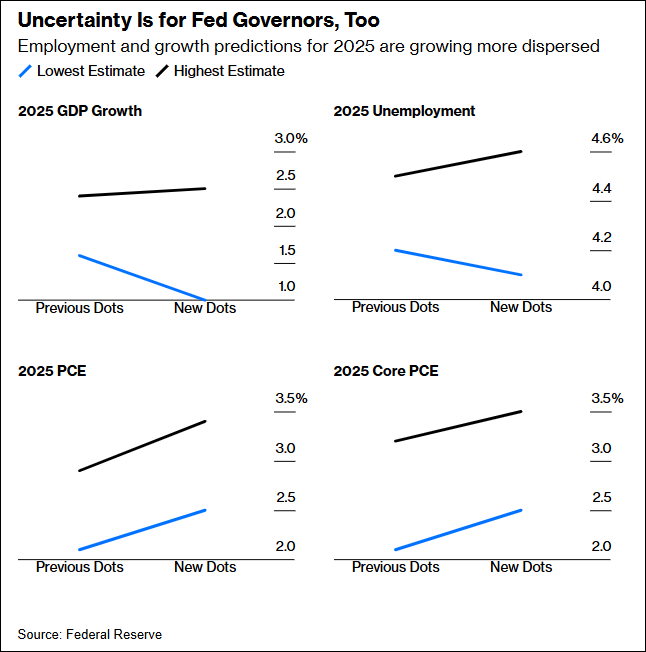
As you can see in the chart below that illustrates the changes in the high and low Fed estimates for key economic conditions…
- Growth expectations got wider (more uncertain) and the low estimate dropped significantly.
- Inflation (PCE) expectations rose in both the high and low estimates
Powell was firm in his belief that the Fed was well-positioned to adapt to future conditions and that the tariff policies were making the future very uncertain.
He also suggested that tariffs may result in a “transitory” impact on inflation. Despite the choice of such a notorious description of the inflation threat, the market may have translated that into an optimistic view that an immediate uptick in prices due to tariffs wouldn’t reverse the Fed’s rate-cutting path.
Finally, the dot plot continued to show that the most popular expectation among the governors for where the Fed Funds rate would sit at year-end was still 3.75 – 4.0. However, the number of dots lower than this level shrunk from 5 to 2 and the number of dots above this level rose from 4 to 8.
So based on the data, the dot plot expectations for 2 cuts by year-end also became more uncertain.
Did the Market Bottom or Bounce?
As Keith covers in this week’s video, the market internals and bearish sentiment had reached levels that typically enable falling markets to find support.
The video also illustrates the importance of the markets’ (SPY and QQQ, most importantly) and getting back over the 200-day moving average.
In January, we spent a lot of time discussing, teaching, and highlighting the importance of what we call the January Calendar Range. The key takeaway of this indicator as you move into the year is that markets that drop below the low of this January range (that forms in the middle of January) are bearish.
With the SPY, QQQ and many other important markets in bearish Calendar Range patterns, it’s a good time to look at what is ‘holding up’ as the market is essentially waiting for clarity on the tariff day of April 2nd.
Even when the market feels like it’s just waiting for clarity, investors are often buying what they believe in if the market has any bullish bias.
Since it’s only March, one way to find pockets of ‘bulls’, and a shortcut to the Calendar Range concept is looking at YTD performance. Below you’ll see a chart of various assets on a year to date basis.
Year To Date Percent Change
Last week, we discussed looking at the performance of the consumer sector ETFs (XLP, XLY, XRT) as a potential sign of any bullish sentiment that could suggest a bottom.
This week I’d like to point out a few noteworthy conditions in the chart above to consider watching for insight into what the market may be thinking leading up to and trading beyond April 2nd.
- The market has been dragged down by the Magnificent 7 (MAGS). These stocks are down big and have most weight in the SPY and QQQ.
- However, the market in other areas is not as damaged. For example, the equal weight SPY (RSP) is essentially flat of the year, and the cyclical sectors (CYCLICAL) are up 3%. Additionally, the Risk Off sectors (RISKOFF) are also up (4.39%) on the year.
- Global markets like EEM, VGK, FXI are all up nicely. While the conversation about foreign markets has mostly focused on their “outperformance”, consider the implications of the simple fact that they are performing well. This should lend some confidence to underlying strength in economies and our markets.
On a more precise level, looking at RSP sitting at important inflection points and the US sectors that are leading this year can provide some insight.
In the chart below you see the RSP with the Calendar Range high and low marked in green and red respectively. Note how it has a potential range reversal pattern (rejected a breakdown quickly).
As a result, a move above its 200-day MA (green avg) would be a bullish reversal. This is particularly, important because it has been stronger that the SPY.
Next, look at a sector from the CYCLICAL segment – the Industrials (XLI). You’ll see a similar reversal pattern sitting on the 200-day MA
Next, look at a sector from the RISKOFF segment – Consumer Staples – XLP. It is sitting on the support of its Calendar Range high!
All three of these ETFs, RSP, XLP, and XLI are outperforming and most are up on the year. If the market starts to muster up some bullish confidence that is more than just a bounce in oversold areas, it will likely show up in these ETFs.
Watch and listen to how the sectors and markets respond to the news.
Summary: Seasonal patterns and market internals offer hope that the short-term bounce will materialize into stronger market action. However, markets need to get back over their 200-Day Moving Average or see the trend strength indicator (TSI) turn positive to confirm the readings.
Risk On
- The Dow, Nasdaq, and Russell closed marginally positive on the week with the S&P 500 basically flat. (+)
- Volume patterns improved with the Nasdaq having more accumulation days than distribution. (+)
- More sectors closed positive on the week than down, with retail recovering while risk-off sectors such as utilities, staples were weak. Though, technology and semiconductors still lagged. (+)
- Market internals significantly improved with the McClellan Oscilator breaking its negative trend from January and turning positive. (+)
- The NYSE New High New Low ratio flipped to a buy signal from oversold readings. (+)
- The number of stocks above key moving averages dropped on Friday, though on the week it has been recovering off its lows and went above the 50% level. (+)
- Dr. Copper exploded to new highs, though it is overbought on the short-run. The Copper price increases don’t point to a recession. (+)
- The short-end of the yield curve supports Fed comments and points towards rates easing. (+)
- Seasonal trends suggest strength in the coming weeks for Nasdaq and S&P. (+)
Neutral
- Foreign equities remain strong overall with some new leadership from India and Brazil this week, while China was weak. This could signal some rotation back into the U.S. (=)
- The color charts (moving average of the number of stocks above key moving averages) is negative over the long-term, but the short-term is improving for the S&P and Nasdaq to a mixed-to-positive reading. The Russell remains negative over all time frames. (=)
- Volatility went down over the week, however, it remains elevated and we still have a positively stacked and sloped bull phase. (=)
- Value stocks continue to outperform growth. Value improved to a weak warning phase and its 50-Day Moving Average is back to sloping positive, while Growth remains under all its key moving averages. (=)
- Foreign equities are in bullish phases and outperforming the U.S., however, both emerging and more developed markets are running a little rich. (=)
- Longer-term rates still look mixed with concerns about the dollar and refinancing the debt. (-)
Risk Off
- The risk gauge slightly improved with the performance of high-yield debt, though remains risk-off. (-)
- The modern family remains overwhelmingly negative, though on the short-run, Semiconductors improved relative the S&P. (-)
Trading in financial instruments and/or cryptocurrencies involves high risks including the risk of losing some, or all, of your investment amount, and may not be suitable for all investors. Prices of cryptocurrencies are extremely volatile and may be affected by external factors such as financial, regulatory or political events. Trading on margin increases the financial risks.
Before deciding to trade in financial instrument or cryptocurrencies you should be fully informed of the risks and costs associated with trading the financial markets, carefully consider your investment objectives, level of experience, and risk appetite, and seek professional advice where needed.
Fusion Media would like to remind you that the data contained in this website is not necessarily real-time nor accurate. The data and prices on the website are not necessarily provided by any market or exchange, but may be provided by market makers, and so prices may not be accurate and may differ from the actual price at any given market, meaning prices are indicative and not appropriate for trading purposes. Fusion Media and any provider of the data contained in this website will not accept liability for any loss or damage as a result of your trading, or your reliance on the information contained within this website.
It is prohibited to use, store, reproduce, display, modify, transmit or distribute the data contained in this website without the explicit prior written permission of Fusion Media and/or the data provider. All intellectual property rights are reserved by the providers and/or the exchange providing the data contained in this website.
Fusion Media may be compensated by the advertisers that appear on the website, based on your interaction with the advertisements or advertisers.