Dicey Economic Reports and the Stock Market 'Echo Bubble'
David I. Kranzler | Dec 11, 2023 12:37AM ET
The Conference Board’s Consumer Confidence for November is 102; 101 was expected. However, the big story is that October was revised to 99.1 from 102.6! The November Present Situation is 138.2. October was revised to 138.6 from 143.1. The November Expectations is 77.8; October was revised to 72.7 from 75.6. Why did Conference Board statisticians botch October metrics so badly? Why have there been so many downward revisions to US economic data? Qui bono? – The King Report, November 29, 2023
Many of the Government and some non/quasi-Government association economic reports are being released with suspiciously bullish data only to be revised lower in subsequent months. But the revisions are buried in the reports and never make the headlines. The Conference Board’s Consumer Confidence survey is one of the examples just from this week. Typically parallel data from the private sector do not corroborate the data from these reports.
The Chicago PMI on Thursday morning, released by the Chicago Institute of Supply Management, spiked up to an index level of 55.8 from 44 in October and vs 45.4 expected by Wall Street. The report triggered a 1.47% manic rally in the Dow, though the SPX closed up 0.38% and the Nasdaq was red. The big jump in “measured” economic activity was one of the biggest “beats” in the history of the index, with a 13-sigma beat (i.e. the probability that the reported result is the actual result is near-zero).
I think the explanation for the unexpected spike in the Chicago PMI data is attributable to the fact that auto labor union strike was resolved in November. The Chicago Fed region hosts a large number of automotive OEM parts suppliers and many other businesses related to the manufacturing of automobiles. All of the sub-index components of the Chicago PMI, in my opinion, reflect the surge in orders, shipments and other economic activity related to the post-labor settlement ramp-up of automotive manufacturing.
The Chicago PMI likely does not have a methodology to adjust, or “smooth out,” the data points connected to the post-strike ramp-up in automobile production. Thus, I am confident that this particular economic report does not support the “recession avoided” narrative promoted by the Biden people, the Fed and Wall Street. In fact, a day later S&P Global reported its Manufacturing PMI and it showed a decline to 49.4 from 50 in October, driven by a decline in new orders and employment. A reading below 50 indicates a contraction in business activity.
Speaking of the Fed, the Fed’s Beige Book for November said the economy continued to show a slowdown in activity from the October report. The October report basically said that economic activity stagnated. The point here is that the Chicago PMI in all probability does not at all reflect economic reality. This is particularly true given that the other major Fed regional bank economic indices, as well as the leading indicators, point to a continued contraction in economic activity.
The ISM Manufacturing PMI for November was reported at 46.7, unchanged from October, but was expected to improve to 47.6 by Wall Street. All sub-indices contributed negatively (new orders, production, employment, inventories and supplier deliveries). However, contrary to the Chicago PMI which said that prices paid moderated, the ISM prices paid jumped higher. Some of the respondents to the survey described their business sector (fabricated metal products, chemicals) as in recession.
Further reinforcing the recession view, the Cass Transportation Index shows continued contraction in shipping and freight transportation activity. The shipments index fell 4.7% MoM and 9.5% YoY; the expenditure index declined 2.2% MoM in October and 23% YoY; and the truckload linehaul index fell 0.6% MoM and 8.3% YoY. The timeline charts for all of these indices are down considerably from the peak in early/mid-2022 and down to their respective levels in late 2020/early 2021. Freight transportation directly reflects the level of economic activity at all levels of the economy.
The Cass metrics thereby do not corroborate the heavily massaged Government and trade association economic reports. Certainly, the Leading Economic Indicators, reported in mid-November, having declined for 19 straight months indicate that the U.S. economy is in recession.
The reason I’m hammering on this is that another stock market “echo bubble” has reinflated, particularly in the cyclically sensitive Dow Jones Industrial, fueled by a dovish pivot by the Fed and hyperinflated market expectations of rate cuts and money printing in 2024. In fact, the Dow appears ready to go parabolic:
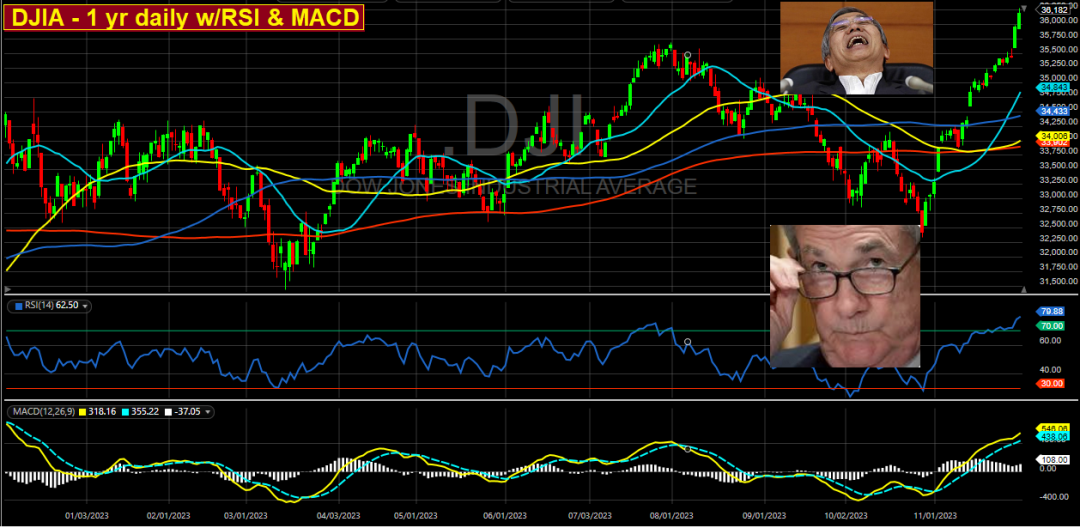
The Dow is just 1.6%, or about 600 points, from the all-time high close on January 4, 2022. In comparison, the Nasdaq is still 12.5% away from its ATH while the SPX is 4.6% below its ATH. Speculative frenzy, momentum-chasing and outright gambling have engulfed the stock market, fueled by a Federal Reserve that has stealthily, or maybe so stealthily, ushered more liquidity in the financial system while financial condtions since the last FOMC meeting per the various financial conditions indices (Goldman, for instance) have eased at the fastest rate in four decades. The most overvalued shitco garbage stocks have soared like dot.com stocks during the tech bubble (CVNA and SNAP), for instance). CVNA likely will be in bankruptcy sometime within the next 24 months. It’s high-coupon debt still trades at a big discount to face, which means the bond market believes the equity is a bagel.
I have to believe that this echo bubble will soon quickly deflate, as did the echo bubble that inflated earlier in 2023. Though this market insanity could last for a few more weeks, certainly all of the signs of a top are present. Any fear of risk has evaporated from the market. The VIX has melted down to a level not seen since early February 2020, when the market at the time hit an all-time high. Retail investors have been furiously piling back into the stock market. For the weekly period ending November 22nd (a week ago Wednesday), retail investors net bought $4.8 billion in cash equities. This is 2.3 standard deviations above the last 12-month weekly average and the highest weekly inflow since April 2022.
In terms of sentiment, the CNN Business Fear & Greed index is almost back to extreme greed. But even more telling is the American Association of Individual Investors (retail, high net worth) sentiment readings. The percentage of bullish respondents hit 48.8%, its highest reading since August 2nd (the stock market started a 3-month decline in early August) while the percent of bearish respondents fell to 19.6%, the lowest level since January 3, 2018. The spread between the bullish and bearish respondents, at 29.2 points, is more than four times higher than the historical average for the differential.
Finally, sentiment and investor positioning is getting “stretched” again to extreme bullishness. As an example, a sentiment indicator compiled by Goldman Sachs measures stock positioning across retail, institutional and foreign investors versus the past 12 months. Readings below -1.0 or above +1.0 indicate extreme positions, long or less long and very short. The indicator is a reliable contrarian signal. Currently, the indicator shows extreme long positioning. Part of this is the automatic algo positioning of CTA funds. They have piled head-first into long positions. It could unwind at any moment.
Circling back to the integrity of Government economic reports, the differential between the Gross Domestic Income (GDI) measurement and the Gross Domestic Product (GDP) measurement is the widest in the history of the two data series. The differential in the YoY% between the two metrics is 3 points, with the GDP three points higher than the GDI. The GDI measures the total income generated by all sectors of the economy including wages, profits and taxes (tax revenues have been declining, by the way).
The Government (BEA) claims that two metrics conceptually are equivalent. However, conceptually, the level of corporate revenues, income and tax revenue generated is a more accurate measure of wealth output and it can be measured more accurately than the GDP variables, which are estimated/ guesstimated and statistically massaged (GDP = consumption + investment + Government spending + exports – imports).
The point here is that, based on the GDI rather than the GDP, the economy is not generating the level of wealth portrayed by the quarterly GDP calculus. In fact, in Q3 the GDI registered a slight YoY percentage decline. 2001 and 2007 were the only other times going back to 1971 the GDP was positive YoY while GDI was negative. In both cases the economy spiraled into tough recessions.
Speaking of the economy, Best Buy (NYSE:BBY) and Lowes both cut their forecasts and warned that shoppers were pulling back on big-ticket items like appliances ahead of the holiday season. This is particularly true for higher-income demographics. According to a report from Bloom-berg, foot traffic at shopping malls that serve higher-income areas is starting to decline for the first time since the pandemic. In October, 21 of the 25 shopping areas surveyed across the country posted declines in foot traffic, with overall foot traffic down 3.3% YoY for the latest three-month period. I have been making the case that household disposable income is tapped out. Further, based on early holiday spending reports, use of buy now/pay later credit is soaring.
Trading in financial instruments and/or cryptocurrencies involves high risks including the risk of losing some, or all, of your investment amount, and may not be suitable for all investors. Prices of cryptocurrencies are extremely volatile and may be affected by external factors such as financial, regulatory or political events. Trading on margin increases the financial risks.
Before deciding to trade in financial instrument or cryptocurrencies you should be fully informed of the risks and costs associated with trading the financial markets, carefully consider your investment objectives, level of experience, and risk appetite, and seek professional advice where needed.
Fusion Media would like to remind you that the data contained in this website is not necessarily real-time nor accurate. The data and prices on the website are not necessarily provided by any market or exchange, but may be provided by market makers, and so prices may not be accurate and may differ from the actual price at any given market, meaning prices are indicative and not appropriate for trading purposes. Fusion Media and any provider of the data contained in this website will not accept liability for any loss or damage as a result of your trading, or your reliance on the information contained within this website.
It is prohibited to use, store, reproduce, display, modify, transmit or distribute the data contained in this website without the explicit prior written permission of Fusion Media and/or the data provider. All intellectual property rights are reserved by the providers and/or the exchange providing the data contained in this website.
Fusion Media may be compensated by the advertisers that appear on the website, based on your interaction with the advertisements or advertisers.