Dead Cat Bounce Or Bottom? What History Tells Us About The Market's Near Future
Keith Schneider | May 30, 2022 01:31AM ET
After 7 consecutive negative weeks for the S&P 500 (8 for the Dow), we witnessed a healthy reprieve this past week.
The stage for the past week’s rally was set by the prior week’s wild Friday (May 20th), during which the S&P 500 was down over 2% intraday and within a whisker of hitting the commonly accepted bear market designation of a 20% correction from all-time highs. However, as the media highlighted the bear market level, the market reversed and rallied to end the day in the green.
Monday’s follow-up rally created a 2-day pattern that market technicians (chart readers) could label as a reversal. Tuesday’s negative price action tested this idea, and then the healthy rallies that followed on Wednesday, Thursday, and Friday proved the pattern correct. The S&P 500 closed the week up 6.5% and over 9% higher than the prior week’s “bear market” low. It was the biggest weekly gain since Nov. 6, 2020 (+7.3%) and two other weeks that market the 2020 pandemic low.
More importantly, we finally had a positive week and broke the longest losing streaks since 2001 and 1932 in the S&P 500 and the Dow respectively.
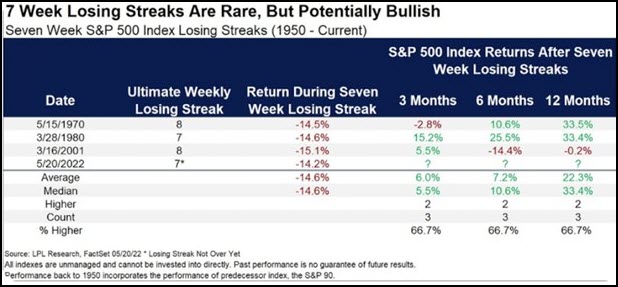
While consecutive 7-week losing streaks are rare in the S&P 500, they are not without precedent. They often are indicative of weakening economic indicators. Many times, they precede downward earnings revisions. However, while rare, they are often followed by a future winning track record. See below:
Many talking heads believe this past week’s positive rally was due to the reporting of slightly lower indications of inflation. The April PCE (Personal Consumption Expenditure), a Fed favored stat, came in at 0.2% providing evidence that inflation may be peaking. Inflation may be slowing directly as a result of too high commodity prices, mortgage rates spiking, and general demand destruction.
This past week too, the beaten-up sectors experienced huge rebounds. Specifically, consumer discretionary, technology, and real estate were the leaders. As we noted in last week’s Market Outlook, this market moves fast and furious. More on that in the Big View section below.
Have we seen the bottom or is this just a bounce?
That will remain the big question. However, if you manage your investments tactically and actively rather than strictly buying and holding, there are opportunities in either outcome.
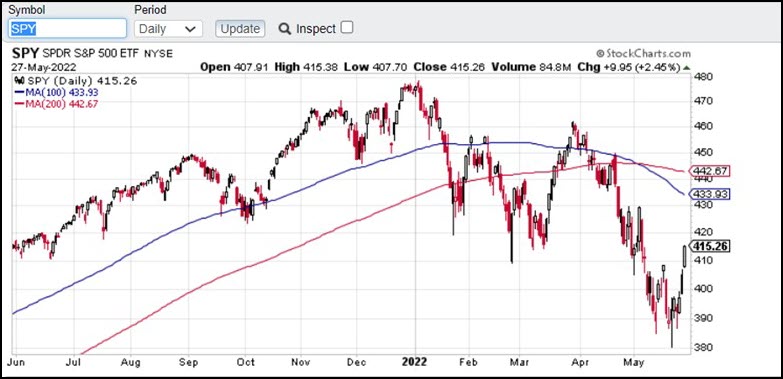
From a technical standpoint (more in Big View below), the S&P 500 (via SPY) is well below both the critical 100-day (blue line) and 200-day (red line) moving averages. And both of those averages remain in a downward sloping line indicating that we are still in an intermediate negative market.
A bottom? Not. The economic indicators remain negative and quite dour on the economy. Let’s pick up from a few weeks ago with a summarized version of our Macro View:
Commodity Prices:
Remains negative. Still very high. Crude prices rose this week and gasoline at the pump is up 50 cents per gallon for the past 30 days and up on average $1.61 a gallon since lasts Memorial Day 2021.
Employment Picture:
We take this from positive to neutral. Many companies are talking about freezing hiring, especially in the Technology sector.
Geopolitical Risk/Turmoil:
Remains negative. Russia is still attacking Ukraine, and there are problems in the Asian sector, including Taiwan and North Korea saber rattling.
Global Supply Chain:
Remains very negative. The baby formula problem is just the tip of the iceberg.
Inflation/Stagflation:
While PCE came in a bit lower providing some relief to the credit markets, don’t kid yourself. The Fed has plenty of hiking to do. Rates should back up again.
Investor Sentiment:
Remains neutral. It has improved, but not enough to turn this negative yet.
Mish’s Modern Economic Family:
Remains Negative. See Big View below.
Monetary Policy:
Negative. Nothing has changed. Fed tightening.
Money Flows:
Neutral. This may improve with the market’s rally. However, past relief rallies did not attract material money flows. People move slowly once fear kicks in
Yield Curve-Interest Rates:
Neutral. This is one area that has improved. Watch High Yield bonds (JNK or HYG) for any indication that this turns negative again.
Summary:
With 4 neutral and 6 negatives, we remain cautious and negative on the economic backdrop. We remain steadfast that we are range-bound and are experiencing stagflation.
A bounce? Absolutely. Buying the market towards the end of a month, right before a holiday, has tended to have an upward bias. However, right after these periods, the market also has a tendency to settle in and has not done as well. See below:
We remain steadfast in our vigilance to manage risk and continue to monitor our Risk Gauges for any sign that it is favorable to become re-invested. With the market indices remaining in negative TSI territory, this also tells us we would be premature to take a risk on approach to the markets.
The table below is a reminder of what we showed a few weeks ago. When the S&P is negative through April, it doesn’t bode well for the full-year performance of the market. Add to this the difficult economic environment as described above, along with a Fed tightening cycle (and reducing their balance sheet), and you have an uncertain environment for risk-on assets.
The Big View:
Risk On
- There was a strong bounce from oversold levels, but we are still in Bear phases for all of the key US equity indices, with resistance at the 50-day moving average. (+)
- IWM found critical support at its 200-week moving average and is in the process of mean reverting on a weekly basis. (+)
- The NASDAQ 100 was the only major index with an accumulation day on Friday despite the market’s rally. (+)
- All sectors were strong on the week, with Retail (XRT) and Consumer Discretionary (XLY) leading and reversing a nasty selloff from last week. (+)
- The Hindenburg Omen indicator is now also at its lowest level since November. (+)
- There is significant improvement with the slope of the New High / New Low ratios across the board for both SPY and QQQ indicating further upside is in the cards. (+)
- Risk Gauges improved across the board, and most importantly, the rally in high yield (HYG)debt and lower interest rates in general were the key drivers for this week’s bullish market action in equities. (+)
- Sentiment indicators are running extremely rich as a result of this massive rally and are at the highest levels in well over a year. However, on a longer-term basis, the number of stocks above key moving averages significantly improved after bouncing off of oversold levels with the strongest slope in several months. (+)
- Although value stocks (VTV) closed in a bullish phase and are still outperforming growth stocks (VUG) by a wide margin, any significant move in growth stocks would be an indication that the overall strength of the market will continue. (+)
- Although every member rallied, the only component of Mish’s Modern Family that didn’t close the week in a bearish phase was Semiconductors (SMH). (+)
- Gold (GLD) closed slightly up on the week but lost ground compared to the S&P500, a risk-on indication. (+)
Risk Off
- Utilities (XLU) is one of the strongest sectors, but its relationship to the S&P 500 is still in risk-off mode. (-)
- There has only been a marginal improvement in volume despite the major rally in the indices, with more distribution days than accumulation days over the past 2 weeks. (-)
- Energy sectors including Oil & Gas Exploration (XOP) +14.8% and Oil Services (OIH) +12.7%, and Metal Mining (XME) +10% were leading this week, indicating inflationary pressures. (-)
- With the strongest rally since November 2020, market internals measured by the McClellan Oscillator rapidly moved from oversold to overbought for both SPY and QQQ on a shorter term basis. (-)
- The US Long Bond (TLT) bounced from oversold levels but is now scraping its upper Bollinger® band very near overbought levels and may already be done. (-)
- Copper (COPX) closed in a recovery phase, indicating inflationary pressures. (-)
- Oil (USO) broke out of an ascending wedge pattern and closed just below all-time highs, adding to inflationary pressures. (-)
Neutral
- Although it backed off, Volatility closed the week still in a bullish phase. (=)
- Foreign equities (EEM and EFA) lost strength against US equities despite closing strong on the week. (=)
- Soft Commodities (DBA) closed in a bullish phase but gave up short-term leadership against the S&P500. (=)
- The US dollar (UUP) dropped this week but it looks to have found support at its 50-day moving average and its lower Bollinger band. (=)
Trading in financial instruments and/or cryptocurrencies involves high risks including the risk of losing some, or all, of your investment amount, and may not be suitable for all investors. Prices of cryptocurrencies are extremely volatile and may be affected by external factors such as financial, regulatory or political events. Trading on margin increases the financial risks.
Before deciding to trade in financial instrument or cryptocurrencies you should be fully informed of the risks and costs associated with trading the financial markets, carefully consider your investment objectives, level of experience, and risk appetite, and seek professional advice where needed.
Fusion Media would like to remind you that the data contained in this website is not necessarily real-time nor accurate. The data and prices on the website are not necessarily provided by any market or exchange, but may be provided by market makers, and so prices may not be accurate and may differ from the actual price at any given market, meaning prices are indicative and not appropriate for trading purposes. Fusion Media and any provider of the data contained in this website will not accept liability for any loss or damage as a result of your trading, or your reliance on the information contained within this website.
It is prohibited to use, store, reproduce, display, modify, transmit or distribute the data contained in this website without the explicit prior written permission of Fusion Media and/or the data provider. All intellectual property rights are reserved by the providers and/or the exchange providing the data contained in this website.
Fusion Media may be compensated by the advertisers that appear on the website, based on your interaction with the advertisements or advertisers.