Data Remains On The Side of The Bulls
Dr. Duru | Apr 02, 2012 03:28AM ET
: 54%
VIX Status: 15.5%
General (Short-term) Trading Call: Trade with a bullish bias.
Commentary
Friday’s T2108 (54%) and VIX (15.5) numbers are an exact repeat from Wednesday’s. The S&P 500 closed slightly up for the week but there was a lot of excitement in between.
I was able to execute several more successful trades on SSO calls, especially as the S&P 500 bounced nicely off lows on Wednesday and Thursday. While sellers were able to erase all the gains from the last impressive breakout, they could not keep the index CLOSED below those levels. So, no surprise then that the S&P 500 rallied a bit on strong buying volume to close out the month and the quarter.
The bullish bias remains firmly in place.
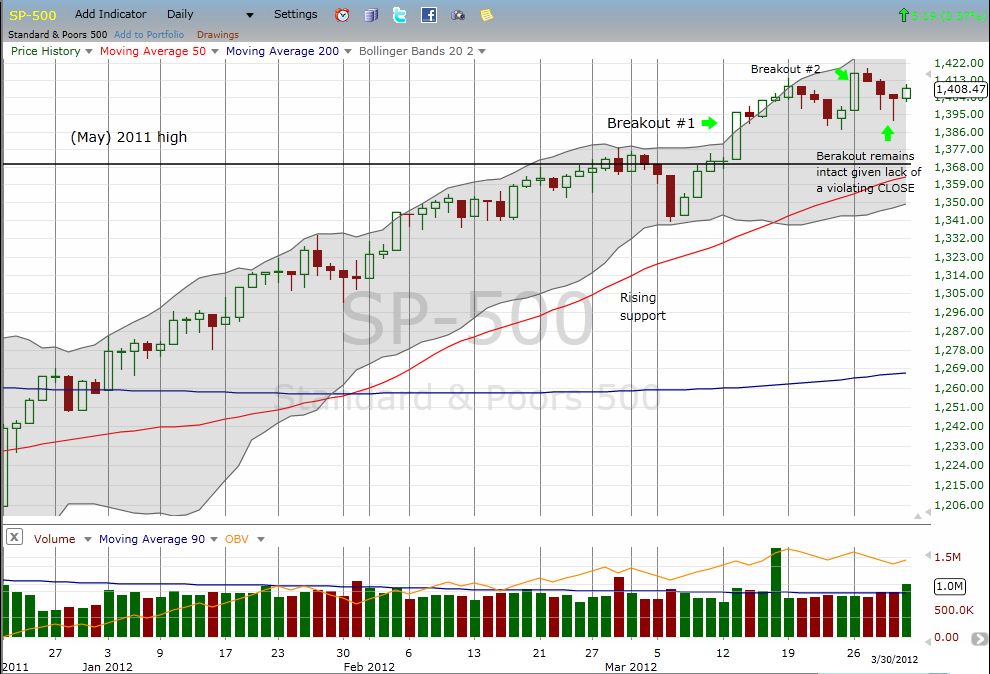
An impressive close to an impressive quarter
With T2108 sitting at 54% there remains plenty of room for more upside as buyers looking for relative “bargains” amongst the stocks that have started diverging from the S&P 500′s good fortunes. Again, I will maintain my bullish bias until at least the next trip to overbought territory given the strong performance that tends to follow extended overbought periods like the one that started 2012.
On Friday’s Nightly Business Report, Sam Stovall, Chief equity strategist from S&P Capital IQ provided some interesting historical stats on S&P 500 performance although he did not fully explain the date range for the data (emphasis mine):
Whenever we have had an advance in the first quarter in excess of 5 percent, following an advance in the fourth quarter, in excess of 5 percent, as we did this time, the market has advanced 80 percent of the time in April, posting a 2.5 percent gain on average. And also has advanced more times than not in the second quarter, gaining 4 percent on average. So, it appears as if possibly the trend will remain our friend…Let`s face it, we are now in the first year of a new bull market. After suffering through more than 21 percent decline on an intraday basis going back through the October of last year.
Stovall failed to mention the length of the relevant historical period, but these data are very consistent with my historic analysis of overbought periods. Stovall’s reference to the October lows is a great reminder of how last year’s multiple swoons likely washed out a lot of sellers from the market, paving the way for even the light volume advances that persist on the major indices.
The Caterpillar (CAT) watch continues, and I have included it in my important list of charts to track. Currently, the new downtrend remains intact, but it bounced enough to avoid closing March on a new low. CAT is also still very oversold on stochastics. As a reminder, CAT’s recent breakdown is now my biggest non-confirming signal of this rally.
Finally, note a few other changes. The trading call has been changed from “hold with a bullish bias” to “trade with a bullish bias.” This change more accurately reflects my current strategy since I continue to hold ProShares Ultrashort S&P 500 ETF (SDS) shares and the iPath S&P 500 VIX Short-Term Futures ETN (VXX) calls as important hedges to my aggressive short-term trading in ProShares Ultra S&P 500 (SSO) calls and VXX puts.
Also, going forward, I will minimize the amount of detail I provide on trades in the T2108 Update. I am trying to shorten the amount of time it takes to write these summaries and provide just the most critical info and data. I will break down trades in the T2108 Update if I feel they are particularly instructive (whether good or bad).
Charts below are the latest snapshots of T2108 (and the S&P 500) Refresh browser if the charts are the same as the last T2108 update.
Black line: T2108 (measured on the right); Green line: S&P 500 (for comparative purposes)
Full disclosure: long SDS; long SSO calls; long VXX calls and puts; long CAT shares and puts
Trading in financial instruments and/or cryptocurrencies involves high risks including the risk of losing some, or all, of your investment amount, and may not be suitable for all investors. Prices of cryptocurrencies are extremely volatile and may be affected by external factors such as financial, regulatory or political events. Trading on margin increases the financial risks.
Before deciding to trade in financial instrument or cryptocurrencies you should be fully informed of the risks and costs associated with trading the financial markets, carefully consider your investment objectives, level of experience, and risk appetite, and seek professional advice where needed.
Fusion Media would like to remind you that the data contained in this website is not necessarily real-time nor accurate. The data and prices on the website are not necessarily provided by any market or exchange, but may be provided by market makers, and so prices may not be accurate and may differ from the actual price at any given market, meaning prices are indicative and not appropriate for trading purposes. Fusion Media and any provider of the data contained in this website will not accept liability for any loss or damage as a result of your trading, or your reliance on the information contained within this website.
It is prohibited to use, store, reproduce, display, modify, transmit or distribute the data contained in this website without the explicit prior written permission of Fusion Media and/or the data provider. All intellectual property rights are reserved by the providers and/or the exchange providing the data contained in this website.
Fusion Media may be compensated by the advertisers that appear on the website, based on your interaction with the advertisements or advertisers.