USD/JPY :Potential For Constructive Gains
Ian Copsey | Oct 01, 2015 12:33AM ET
INTRADAY CHART FOR USD/JPY
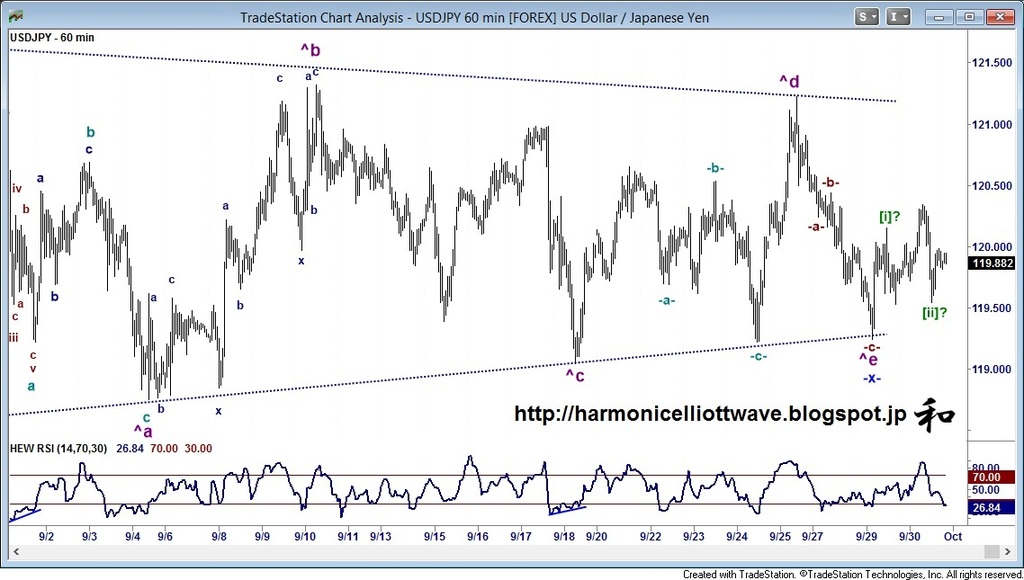
BIAS
: This has potential for constructive gains but needs a little more confirmation
| Resistance: | 120.34-44 | 120.51-61 | 120.80-00 | 121.23 |
| Support: | 119.75-80 | 119.54 | 119.24 | 119.05 |
MAIN ANALYSIS: Yesterday's development formed the potential base for a firmer rally. We now need to see the 119.75-80 area support to allow gains to move back above the 120.34-44 area to extend gains to 120.51-61 and following a minor correction, to the 120.80-00 area - basically holding below the 121.23 high. This should trigger losses - and we'll need to ensure this is corrective. Assuming we then see gains above 121.23 the rally should continue to around 121.71 and maybe as high as 122.26.
COUNTER ANALYSIS: On the downside, a break of 119.50 would concern and then suggest potential for losses of 118.90-05 to extend losses back to 118.75 and then 118.24-44 at least … but if the downside develops it could be quite firm.
MEDIUM TERM ANALYSIS: 29th September: This continues to look like one long, slim triangle although I've seen these develop and then break in the opposite direction... The 119.60-69 area and 119.05-20 area is the key on the downside with breach extending losses... On the other side, a break above 121.23 and 121.63 will edge this closer to the Wave [b] at 125.27...
![]()
Trading in financial instruments and/or cryptocurrencies involves high risks including the risk of losing some, or all, of your investment amount, and may not be suitable for all investors. Prices of cryptocurrencies are extremely volatile and may be affected by external factors such as financial, regulatory or political events. Trading on margin increases the financial risks.
Before deciding to trade in financial instrument or cryptocurrencies you should be fully informed of the risks and costs associated with trading the financial markets, carefully consider your investment objectives, level of experience, and risk appetite, and seek professional advice where needed.
Fusion Media would like to remind you that the data contained in this website is not necessarily real-time nor accurate. The data and prices on the website are not necessarily provided by any market or exchange, but may be provided by market makers, and so prices may not be accurate and may differ from the actual price at any given market, meaning prices are indicative and not appropriate for trading purposes. Fusion Media and any provider of the data contained in this website will not accept liability for any loss or damage as a result of your trading, or your reliance on the information contained within this website.
It is prohibited to use, store, reproduce, display, modify, transmit or distribute the data contained in this website without the explicit prior written permission of Fusion Media and/or the data provider. All intellectual property rights are reserved by the providers and/or the exchange providing the data contained in this website.
Fusion Media may be compensated by the advertisers that appear on the website, based on your interaction with the advertisements or advertisers.