Current Gold & Oil Trading Patterns Unfolding
Chris Vermeulen | Mar 28, 2012 11:21AM ET
The past two months we have seen all the focus from traders and investors be on the equities market. And rightly so and stocks run higher and higher. But there are two commodities that look ready to explode being gold and oil (actually three if you count silver).
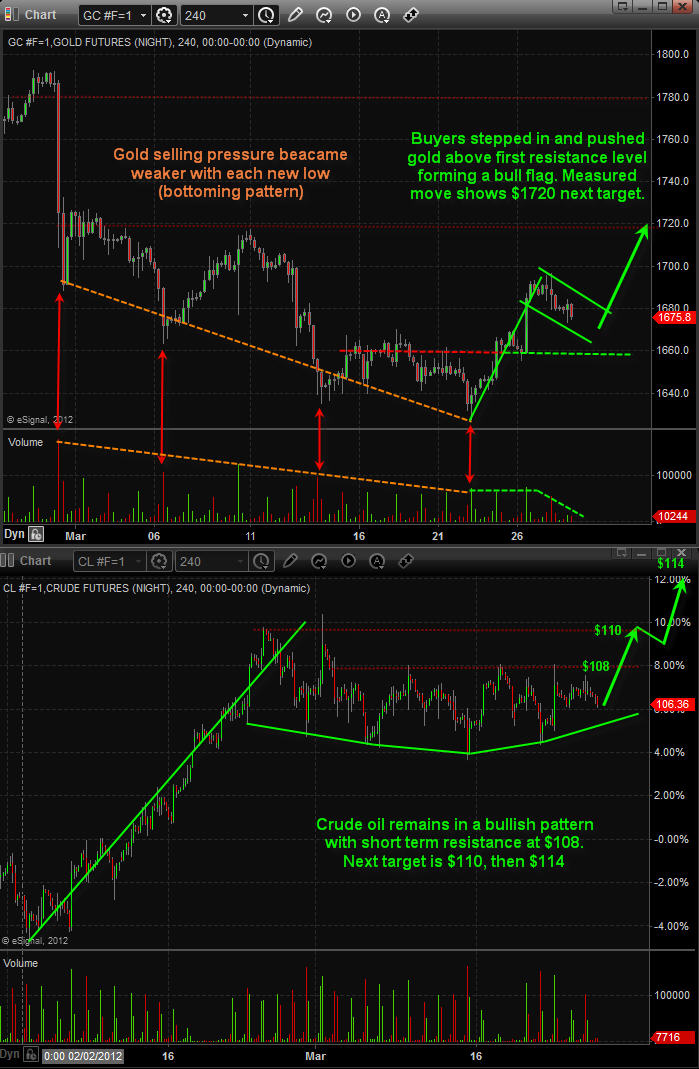
Below are the charts of gold futures and crude oil 4 hour charts. Each candle stick is 4 hours allows us to look back 1-2 months while still being able to see all the intraday price action (pivot highs, pivot lows, strong volume spikes and if they were buyers or sellers…).
The 4 hour chart is one time frame most traders overlook but from my experience I find it to be the best one for spotting day trades, momentum trades and swing trades which pack a powerful yes quick punch.
As you can see below with the annotated charts both gold and silver are setting up for higher prices in the next 1-2 weeks from a technical point of view. That being said we may see a couple days of weakness first before they start moving up again.
Trading in financial instruments and/or cryptocurrencies involves high risks including the risk of losing some, or all, of your investment amount, and may not be suitable for all investors. Prices of cryptocurrencies are extremely volatile and may be affected by external factors such as financial, regulatory or political events. Trading on margin increases the financial risks.
Before deciding to trade in financial instrument or cryptocurrencies you should be fully informed of the risks and costs associated with trading the financial markets, carefully consider your investment objectives, level of experience, and risk appetite, and seek professional advice where needed.
Fusion Media would like to remind you that the data contained in this website is not necessarily real-time nor accurate. The data and prices on the website are not necessarily provided by any market or exchange, but may be provided by market makers, and so prices may not be accurate and may differ from the actual price at any given market, meaning prices are indicative and not appropriate for trading purposes. Fusion Media and any provider of the data contained in this website will not accept liability for any loss or damage as a result of your trading, or your reliance on the information contained within this website.
It is prohibited to use, store, reproduce, display, modify, transmit or distribute the data contained in this website without the explicit prior written permission of Fusion Media and/or the data provider. All intellectual property rights are reserved by the providers and/or the exchange providing the data contained in this website.
Fusion Media may be compensated by the advertisers that appear on the website, based on your interaction with the advertisements or advertisers.