Could This Bullish Pattern Take Gold Above $1300?
Matthew Weller | Jan 15, 2015 03:31PM ET
Thursday was one of the most disorienting and volatile days in global markets in recent memory and if we know anything about traders, it’s that they hate not knowing what’s happening. I already covered the SNB’s shocking decision to drop its peg on the EUR/CHF, but one of the more obvious side effects has been a rally in safe-haven Gold. The yellow metal has served as a store of value for millennia and as my colleague Fawad Razaqzada succinctly summarized Thursday, “[the SNB’s decision] took everyone by surprise, [and] the initial response from the market was obvious: rush to safety. In this regard, gold was the obvious choice...”
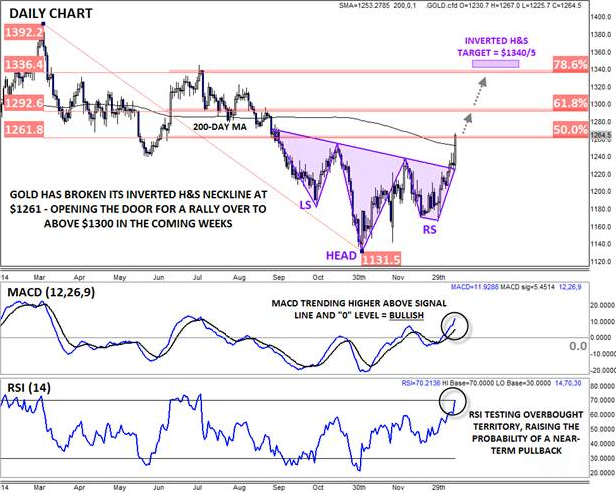
But beyond the supportive fundamental backdrop, gold has also seen a breakout from a big inverted Head-and-Shoulders pattern. For the uninitiated, this classic price-action pattern shows a shift from a downtrend (lower lows and lower highs) to an uptrend (higher highs and higher lows) and is typically seen at major bottoms in the chart. This week’s conclusive break above the “neckline” confirms the pattern and suggests that we may see further strength in the yellow metal over the coming weeks -- a view supported by the bullish trend in the MACD indicator.
As we go to press, gold is pressing against the 50% Fibonacci retracement of last year’s drop at 1261 and with the RSI indicator near overbought territory, a near-term consolidation or pullback is definitely possible. That said, the measured-move target of the inverted H&S pattern comes in all the way up at $1340, so gold rallies are still favored as we move through the rest of the Q1 as long as the yellow metal can hold above its 200-day MA at $1250.
Source: FOREX.com
For more intraday analysis and market updates, follow us on twitter (@MWellerFX and @FOREXcom)
![]()
Trading in financial instruments and/or cryptocurrencies involves high risks including the risk of losing some, or all, of your investment amount, and may not be suitable for all investors. Prices of cryptocurrencies are extremely volatile and may be affected by external factors such as financial, regulatory or political events. Trading on margin increases the financial risks.
Before deciding to trade in financial instrument or cryptocurrencies you should be fully informed of the risks and costs associated with trading the financial markets, carefully consider your investment objectives, level of experience, and risk appetite, and seek professional advice where needed.
Fusion Media would like to remind you that the data contained in this website is not necessarily real-time nor accurate. The data and prices on the website are not necessarily provided by any market or exchange, but may be provided by market makers, and so prices may not be accurate and may differ from the actual price at any given market, meaning prices are indicative and not appropriate for trading purposes. Fusion Media and any provider of the data contained in this website will not accept liability for any loss or damage as a result of your trading, or your reliance on the information contained within this website.
It is prohibited to use, store, reproduce, display, modify, transmit or distribute the data contained in this website without the explicit prior written permission of Fusion Media and/or the data provider. All intellectual property rights are reserved by the providers and/or the exchange providing the data contained in this website.
Fusion Media may be compensated by the advertisers that appear on the website, based on your interaction with the advertisements or advertisers.