Could 2025 Be a Golden Year for Mining Stocks?
Stewart Thomson | Jan 02, 2025 06:59AM ET
As the year 2024 comes to an end, the US stock market has become even more overvalued while being trumpeted as a poster boy for the well-being of America.
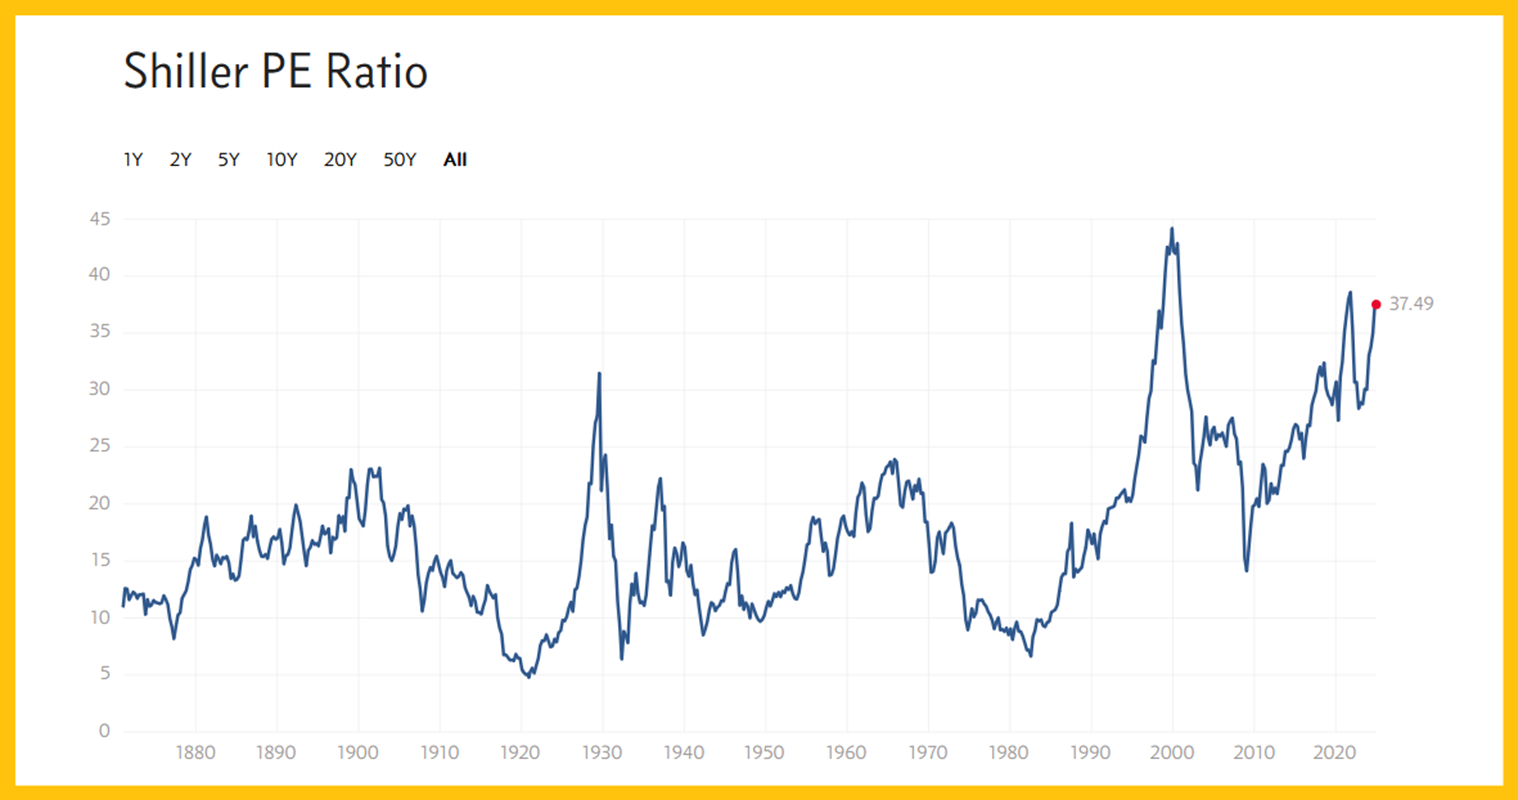
Basis the Shiller/Cape ratio, the US stock market is vastly more overvalued than it was in 1929.
US money printing and debt are the “hallowed pillars” that have allowed it to stay overvalued since the 2008 lows, but as the Trump administration 2.0 begins its reign, that’s likely to change.
In early 2025, in anticipation of an end to the free money ride, the US stock market could quickly begin to look like a hybrid of the 1929 and 1966 debacles.
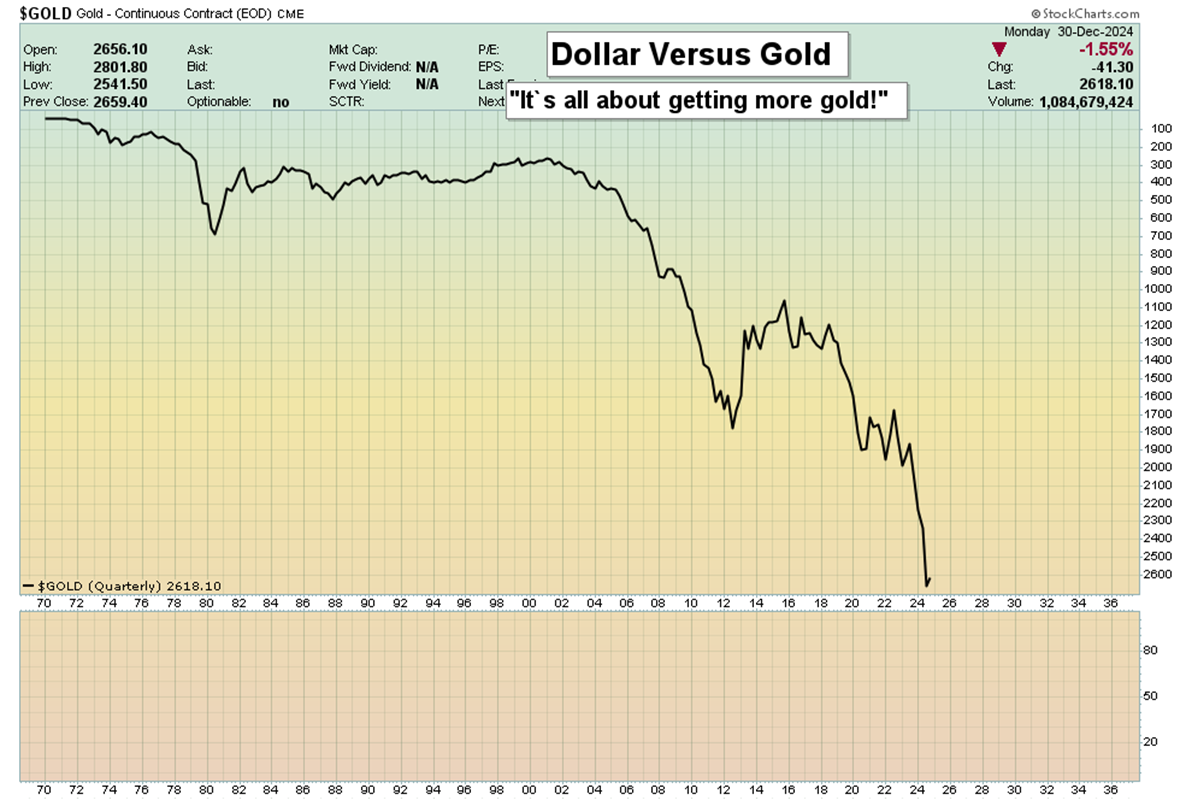
While major fiat currencies are burning against the dollar, the dollar itself is in a death spiral against supreme money gold. The situation is perhaps best described as eery and ominous.
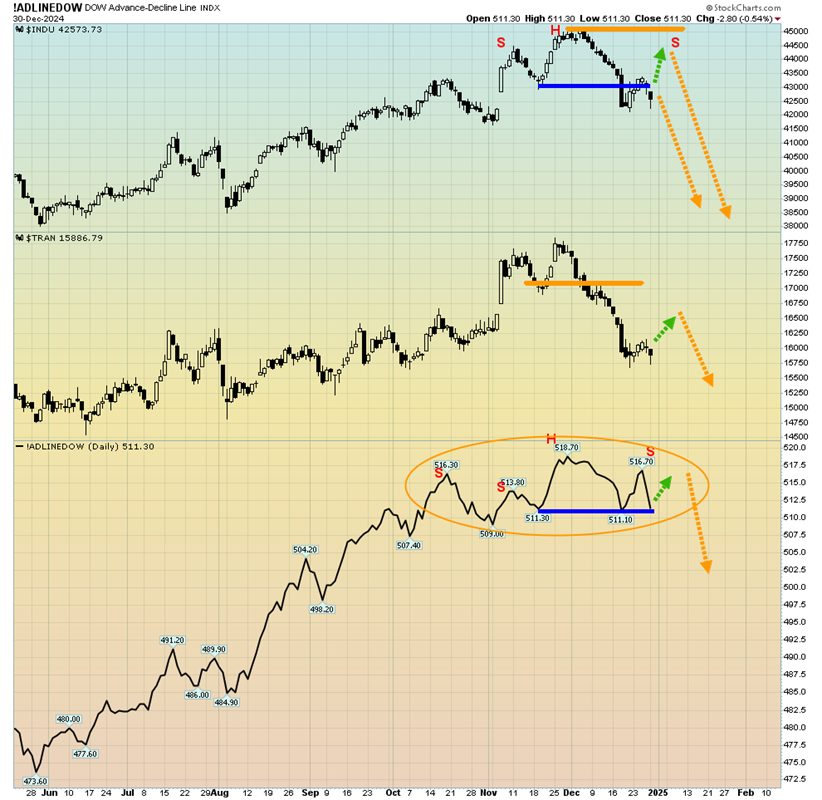
The stock market advance/decline line looks shaky, as do the Dow Transports. The Industrials also look toppy.
From a price/earnings ratio perspective, to reverse the overvalued situation of most of the US stock market while it continues to rise…
Rather than the supposedly awesome 3% GDP growth that most analysts are projecting, it’s likely that GDP growth of about 20% (or more) would be required to alleviate the danger.
What about the purported key relationship of the dollar index (USDX/DXY) and gold? In 1976, the dollar index was at about 108, and it’s about 108 now. In 1976, gold was about $100, and it’s $2600 now!
Gold scored a “26 bagger” against the dollar index while the dollar index went nowhere. In a nutshell, there are short-term moments in time when the dollar index rises and gold dips, but…
Gold, silver, and mining stock investors should not focus on the failing fiat dollar’s supposedly great action versus various other failing fiats. They should focus on the dollar versus gold, with the sole goal being not to make “big fiat profits” but instead to get more gold.
Note the 14,5,5 series Stochastics action at the bottom of this weekly gold chart. The overbought situation has been worked off.
The oscillator could turn up here, but if it becomes oversold as the price arrives at support of size like $2550, gold, gold stocks, and silver bullion will be solid buys.
Yesterday was an important day for the BPGDM sentiment index. It’s down to under 40 now and getting closer to the “no-brainer” buy zone of 30.
The CDNX weekly chart shows a loose inverse H&S base pattern and a breakout above 620-640 could create a powerful rally.
A look at the daily chart. Note the action of the 14,7,7 series Stochastics oscillator at the bottom of the chart.
Junior mining stock investing isn’t suitable for every gold bug, but when these stocks do well as a group, it usually indicates that intermediate and senior producers will fare well too.
What about GDX? The weekly chart. The Stochastics oscillator is fully oversold and GDX is just above support at $32.
Another look at it, the daily chart. A huge symmetrical triangle is in play and the current pullback could end near the apex at $32-$30. Also, note the GDX vs gold action at the top of the chart. GDX is very close to major support against gold!
For a third look at GDX. The RSI oscillator is not confirming the drop in price below the November low. That’s a positive sign.
The SGDM ETF is an alternative to GDX, and it’s sporting a huge reversal candlestick on this daily chart. Stochastics is also looking good and the same bullish non-confirmation of RSI with the price is in play.
Companies like Barrick are massively oversold on their weekly charts and some have insider buying. To sum up the situation: 2024 was a big year for gold and 2025 could be even bigger for the stocks of companies that mine it. Happy New Year to all gold stock investors of the world!
Trading in financial instruments and/or cryptocurrencies involves high risks including the risk of losing some, or all, of your investment amount, and may not be suitable for all investors. Prices of cryptocurrencies are extremely volatile and may be affected by external factors such as financial, regulatory or political events. Trading on margin increases the financial risks.
Before deciding to trade in financial instrument or cryptocurrencies you should be fully informed of the risks and costs associated with trading the financial markets, carefully consider your investment objectives, level of experience, and risk appetite, and seek professional advice where needed.
Fusion Media would like to remind you that the data contained in this website is not necessarily real-time nor accurate. The data and prices on the website are not necessarily provided by any market or exchange, but may be provided by market makers, and so prices may not be accurate and may differ from the actual price at any given market, meaning prices are indicative and not appropriate for trading purposes. Fusion Media and any provider of the data contained in this website will not accept liability for any loss or damage as a result of your trading, or your reliance on the information contained within this website.
It is prohibited to use, store, reproduce, display, modify, transmit or distribute the data contained in this website without the explicit prior written permission of Fusion Media and/or the data provider. All intellectual property rights are reserved by the providers and/or the exchange providing the data contained in this website.
Fusion Media may be compensated by the advertisers that appear on the website, based on your interaction with the advertisements or advertisers.