CoT: Peek Into Future Through Futures, How Hedge Funds Are Positioned
Paban Pandey | May 26, 2018 11:03PM ET
Following futures positions of non-commercials are as of May 22, 2018.
US 10 Year Note: Currently net short 358.6k, down 23.3k.
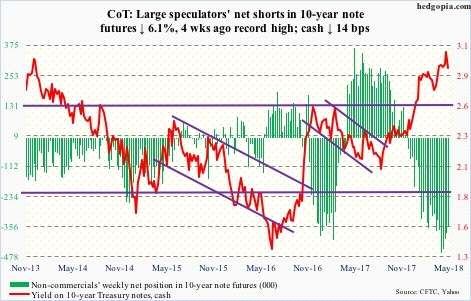
Ten-year Treasury yields (2.93 percent) bottomed intraday at 2.72 percent on April 2, then quickly rose to 3.12 percent on May 17. The US dollar index rallied from 88.94 on April 17 to Friday’s intraday high of 94.24. The correlation between the two has not been perfect, but of late the greenback has taken its cue from higher rates.
FOMC minutes for the May 1-2 meeting released Wednesday pretty much confirmed an imminent hike in the June 12-13 meeting. The futures market has priced one in. This would be the second 25-basis-point raise this year. In March, the fed funds rate was pushed up by 25 basis points to a range of 150 to 175 basis points. The dot plot from that meeting expected two more hikes this year. After June, four more meetings remain this year. Currently, markets also expect the Fed to move in September. Should it come to pass, the fed funds rate would have risen to 200-225 basis points. Would the dollar follow along? Better yet, what if it does, and/or would it begin to impact the Fed’s interest rate outlook (more here )?
In general, a decline in the value of the dollar tends to raise the price of imported goods, hence contributes to inflation. An appreciating currency can hurt exports, earnings of multinationals, and what not.
As far as FOMC members are concerned, at least in the May meeting, this was not worth worrying about. The minutes said: “The foreign exchange value of the dollar rose modestly, but this move retraced only a bit of the depreciation of the dollar since its 2016 peak.”
True. Prior to the most recent low-to-high six-percent rally, the US dollar index shed 15.1 percent between January 2017 and February 2018.
So for now, the Fed will continue to hike – at least twice more this year. At the same time, it must be hoping that the greenback does not get ahead of itself, pricing in a much tighter monetary policy.
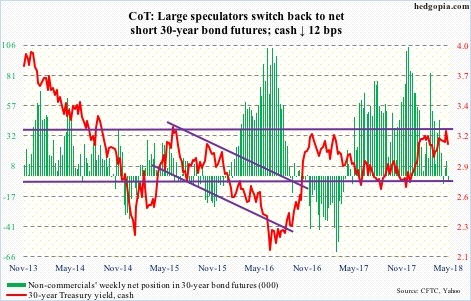
US 30 Year Bond: Currently net short 5.3k, down 17.1k.
Major economic releases next week are as follows:
- Markets are closed Monday. Happy Memorial Day!
- Tuesday brings the S&P Corelogic Case-Shiller home price index for March. Nationally in February, home prices rose 6.3 percent year-over-year. This was the fastest pace since May 2014.
- On Wednesday, GDP (1Q18, 2nd estimate) and corporate profits (1Q18) are due out. The advance estimate showed real GDP grew 2.3 percent in 1Q18 – decent but slower than growth of 2.9 percent, 3.2 percent and 3.1 percent respectively in the prior three quarters.
- Corporate profits adjusted for inventory and capital consumption increased 2.7 percent y/y in 4Q17 to a seasonally adjusted annual rate of $2.21 trillion. The all-time high was reached in 4Q14 at $2.23 trillion.
- Personal income and outlays for April comes out Thursday.
- Core PCE – the Fed’s favorite measure of consumer inflation – jumped 1.88 percent y/y in March, versus increase of 1.57 percent in the prior month. The trend has been up since last September. With that said, the last time it rose with a two handle was in April 2012.
- April’s employment report as well as the ISM manufacturing index are scheduled for Friday.
- Private-sector average hourly earnings in March grew 2.56 percent y/y to $26.84. This metric has not grown with a three handle since April 2009. Manufacturing activity fell two points month-over-month in April to 57.3. February’s 60.8 was the highest since May 2004.
Crude Oil Futures: Currently net long 724.7k, down 2.9k.
Russian energy minister Alexander Novak Thursday raised the possibility that the existing 1.8-million-barrels-per-day output cut may be lowered if the participants conclude the market has rebalanced. OPEC plus 10 other oil-producing nations including Russia meet in late June to discuss the cut, which runs through the end of the year. In addition, the EIA report for the week ended May 18 showed US supply was higher. Both these factors, plus the fact that spot West Texas Intermediate crude ($67.88/barrel) was overbought, technically, led to profit-taking. It lost 4.9 percent for the week.
Non-commercials are still heavily net long. Unwinding can continue.
Friday, the 50-day ($67.49) was touched intraday. Breakout retest takes place at $66.50.
In the aforementioned week, US crude production rose another 2,000 b/d to 10.73 mb/d. As did crude imports, up 558,000 b/d to 8.16 mb/d.
Stocks of both crude and gasoline rose, up 5.8 million barrels to 438.1 million barrels and up 1.9 million barrels to 233.9 million barrels, in that order.
Distillate inventory, however, fell 951,000 barrels to 114 million barrels. Refinery utilization rose seven-tenths of a percentage point to 91.8 percent.
E-mini S&P 500: Currently net long 185.2k, down 13.6k.
Another $3.7 billion moved into US-based equity funds (including ETFs) in the week through Wednesday (courtesy of Lipper.com). This followed inflows of $10.1 billion in the prior week.
Flows into S&P 500-focused ETFs were mixed, but were positive nonetheless. In the same week, SPDR S&P 500 (NYSE:SPY) ETF took in $47 million and ishares S&P 500 (NYSE:IVV) ETF $453 million, while Vanguard S&P 500 (NYSE:VOO) ETF lost $12 million (courtesy of ETF.com).
The cash (2721.33) continued to trade within a two-plus-week box, with 2700 drawing bids, but rather lethargically. The week produced a doji. A test of the 50-day (2673.65) is likely.
Euro Futures: Currently net long 109.7k, down 5.4k.
Eurozone business activity slowed for the fourth straight month in May. IHS Markit’s composite PMI dropped a point m/m in May to 54.1. The consensus was expecting a drop to 54.8. Of late, data has been softening, and this is one more to possibly enable Mario Draghi, ECB president, to continue to maintain dovish posture.
The cash ($116.55), having dropped seven percent from late January, is trying to stabilize, with no success thus far.
Gold Futures: Currently net long 91k, down 1.5k.
Before the cash ($1,303.70/ounce) jumped 1.2 percent Thursday, there were six straight sessions of long-legged dojis, spinning tops and hammers. Support at $1,280s, which represents a rising trend line from December 2016, has been defended.
Flows continue to be a negative, but technicals may be turning in gold bugs’ favor. The 200-day is their next goal. The average, which approximates the broken-support-turned-resistance, is right above.
In the week to Wednesday, GLD ETF (SPDR gold ETF) lost $171 million, and iShares Gold (NYSE:IAU) $21 million (courtesy of ETF.com).
Nasdaq 100 Futures: Currently net short 3.7k, up 3.7k.
The bull-bear duel continues at an interesting juncture.
The intraday high of 7008.26 two weeks ago can potentially mark the right side of a head-and-shoulders pattern. This can develop into something bearish. At the same time, for three weeks now the cash (6960.92) has generated buying interest at 6850, with cooperation from flows.
PowerShares QQQ Trust Series 1 (NASDAQ:QQQ) in the week to Wednesday attracted $434 million (courtesy of ETF.com).
SmallCap 2000 Futures: Currently net long 65.1k, up 11.9k.
Thus far, it has been a classic textbook case of breakout followed by retest.
The cash (1626.93) seven sessions ago took out its prior high from late January, rose a bit more to a new high of 1639.89 Tuesday, then retreated, only to be met by new buying. With that said, it it too soon to declare it is all-clear for the bulls. This can as easily turn into a bull trap. The breakout is all too fresh, and is yet to be digested.
As things stand, the bulls deserve the kudos – for not only forcing a breakout but also defending it. And also for putting their money where their mouth is. In the week ended Wednesday, iShares Russell 2000 (NYSE:IWM) gained $1.2 billion and iShares Core S&P Small-Cap (NYSE:IJR) $377 million (courtesy of ETF.com). Non-commercials continued to add to net longs.
For all this, the cash only managed to tread water in the week – a doji week.
US Dollar Index Futures: Currently net long 2.6k, up 2.6k.
Between early last year and February this year, the cash (94.13) dropped from 103.82 to 88.15. A 38.2-percent retracement of this decline lies at 94.14. This can pose resistance.
As extended as the daily chart is, momentum is intact. Dollar bulls hope non-commercials are just warming up.
VIX Futures: Currently net short 25.6k, up 21.8k.
Attempts to rally past the 200-day (13.83) on the cash (13.22) were sold both Wednesday and Thursday. In a worse-case scenario for volatility bulls near term, the daily lower Bollinger band® lies at 11.66. In the past, this has reliably provided support.
Elsewhere, the 21-day moving average of the CBOE equity-only put-to-call ratio dipped to .605 Thursday. If past is prologue, high .50s-low .60s indicates elevated investor optimism – elevated enough it pays to play contrarian near term.
Thanks for reading!
Trading in financial instruments and/or cryptocurrencies involves high risks including the risk of losing some, or all, of your investment amount, and may not be suitable for all investors. Prices of cryptocurrencies are extremely volatile and may be affected by external factors such as financial, regulatory or political events. Trading on margin increases the financial risks.
Before deciding to trade in financial instrument or cryptocurrencies you should be fully informed of the risks and costs associated with trading the financial markets, carefully consider your investment objectives, level of experience, and risk appetite, and seek professional advice where needed.
Fusion Media would like to remind you that the data contained in this website is not necessarily real-time nor accurate. The data and prices on the website are not necessarily provided by any market or exchange, but may be provided by market makers, and so prices may not be accurate and may differ from the actual price at any given market, meaning prices are indicative and not appropriate for trading purposes. Fusion Media and any provider of the data contained in this website will not accept liability for any loss or damage as a result of your trading, or your reliance on the information contained within this website.
It is prohibited to use, store, reproduce, display, modify, transmit or distribute the data contained in this website without the explicit prior written permission of Fusion Media and/or the data provider. All intellectual property rights are reserved by the providers and/or the exchange providing the data contained in this website.
Fusion Media may be compensated by the advertisers that appear on the website, based on your interaction with the advertisements or advertisers.