China's Battered Demand Could See Cotton Lose All This Year's Gains
Investing.com | Aug 14, 2018 03:27AM ET
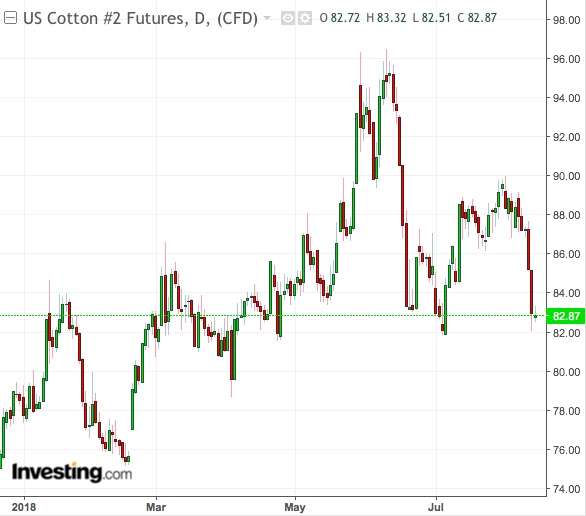
In daily technicals call for a “Strong Sell” on the December contract, with Fibonacci patterns placing strong support at 80.22. A “Buy” is indicated once the contract slips below the 200-day moving average of 81.52, meaning a technical rebound could be imminent.

But some long-time market watchers like Shawn Hackett think prices need to sink another 10 percent to around 75 cents a lb before strong recovery sets in.
The last time US cotton traded at the 75-cent level was in February. The market also began January at 78.66 cents per lb, which means a drop to 75 would wipe out all of this year’s gains.
“The 200-day moving average is an area a lot of people use to chart the market’s potential pivot,” said Hackett, who tracks cotton and other crop futures at his Hackett Financial Advisors in Boca Raton, Florida.
“I’d say major support is 75 cents because the market always tends to overreact,” added Hackett. “It always treats things worse than what they are supposed to be. Even though we’ve had a correction, our smart money signal is still neutral to bearish as we move into harvest period.”
H1 2018: A Tale of Mixed Fortunes
This year’s cotton market is a tale of two parts: at first, challenging weather in the United States and India—the third and second largest growers, respectively—pushed prices to 2014 peaks. Later, rains reduced crop stress, and the impact of the strong dollar and tariffs on imports by China—No. 1 cotton producer and consumer—led to demand destruction.
The US Department of Agriculture (USDA) added to the market’s bearish touch on Friday with an updated 2018/19 production outlook pegged at 19.24 million bales, well above the average trade expectation for 18.39 million and above the top end of the range of estimates of 18-19 million.
The USDA said domestic ending stocks of cotton rose to 4.6 million bales from 4.0 million bales. While export demand also rose, it wasn’t enough to make up for the bigger supplies.
“The world data showed that major exporters would have less cotton, but the change was not real big,” said Jack Scoville, analyst at Chicago brokerage Price Futures Group. “Speculators were the biggest sellers after the reports were released, and they probably have a lot more selling to do this week as they have held major long positions until now.”
As for weather, he said conditions were favorable in the US Delta and Southeast growing areas, while they would remain hot and dry from West Texas to further West. In India, rains have been below normal, but generally good enough to support crops.
The trade will also be keeping a close watch on demand, Scoville said. “Weekly US export sales reports have been good so far, but China has mostly been absent. There is talk that China will find a way to buy US Cotton as it will need the quality. The market needs to factor in the higher-than-expected production and overall supplies first, then the rally might be able to resume.”
For now, the path of least resistance was lower, ADM Investor Services said in a note on cotton issued Monday.
“With plenty of bearish news and managed money (fund) traders net long 86,360 contracts, the market looks set for additional long liquidation ahead,” it added.
Trading in financial instruments and/or cryptocurrencies involves high risks including the risk of losing some, or all, of your investment amount, and may not be suitable for all investors. Prices of cryptocurrencies are extremely volatile and may be affected by external factors such as financial, regulatory or political events. Trading on margin increases the financial risks.
Before deciding to trade in financial instrument or cryptocurrencies you should be fully informed of the risks and costs associated with trading the financial markets, carefully consider your investment objectives, level of experience, and risk appetite, and seek professional advice where needed.
Fusion Media would like to remind you that the data contained in this website is not necessarily real-time nor accurate. The data and prices on the website are not necessarily provided by any market or exchange, but may be provided by market makers, and so prices may not be accurate and may differ from the actual price at any given market, meaning prices are indicative and not appropriate for trading purposes. Fusion Media and any provider of the data contained in this website will not accept liability for any loss or damage as a result of your trading, or your reliance on the information contained within this website.
It is prohibited to use, store, reproduce, display, modify, transmit or distribute the data contained in this website without the explicit prior written permission of Fusion Media and/or the data provider. All intellectual property rights are reserved by the providers and/or the exchange providing the data contained in this website.
Fusion Media may be compensated by the advertisers that appear on the website, based on your interaction with the advertisements or advertisers.