Charts And Data See A Bit More Improvement
Guy S. Ortmann, CMT | Aug 26, 2021 08:41AM ET
Most Data Remains Neutral
All the major equity indexes closed higher Wednesday with positive internals on the NYSE and NASDAQ as trading volumes declined from the prior session on both exchanges. The charts saw some further improvement with a combination of new closing highs and some violations of resistance.
Market breadth saw some further improvement as well.
Regarding the data, it continues to send a generally neutral near-term message. As such, while we expect the pace of recent progress to moderate, we are maintaining our near-term “neutral/positive” macro-outlook for equities.
On the charts, all the major equity indexes closed higher yesterday with positive internals on the NYSE and NASDAQ as trading volumes declined on both exchanges.
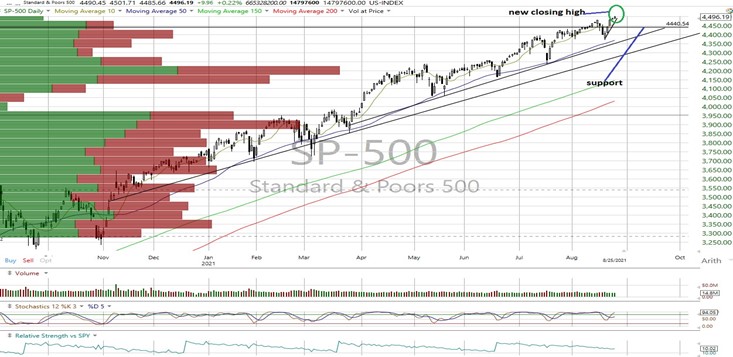
- Positive technical events were registered for the SPX, COMPQX, and NDX as they closed at new all-time highs.
- As well, both the MID and VALUA closed above their near-term resistance levels. As stated recently I n our comments, we believe the action in the MID and VALUA display an improvement in market breadth while the MID is getting very close to what we suspect may be an important technical breakout level.
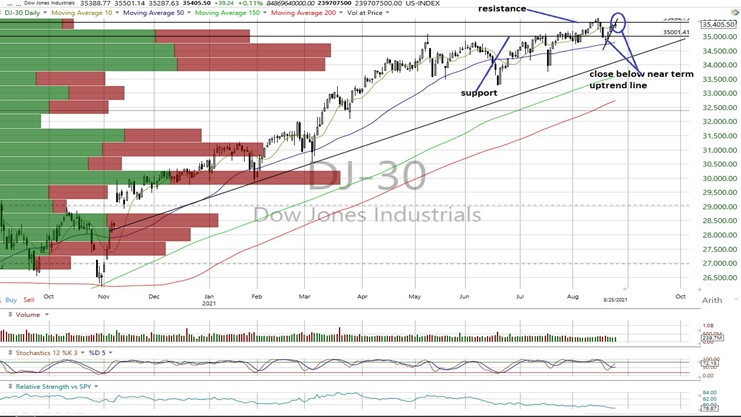
- However, the DJI closed below its near-term uptrend line and is now neutral with all the other indexes in near-term uptrends.
- While not an issue at the moment, we would note the stochastic levels for the SPX, COMPQX and NDX are in the mid-90’s and overbought. We will monitor them for any potential cautionary signals.
The data remains mostly neutral.
- The McClellan 1-Day OB/OS Oscillators remain in neutral territory and are not yet at threatening levels, in our opinion (All Exchange: +32.33 NYSE: +23.51 NASDAQ: +39.28).
- The Rydex Ratio (contrarian indicator) measuring the action of the leveraged ETF traders remains neutral and unchanged at 0.71 as is the Open Insider Buy/Sell Ratio 46.0.
- This week’s contrarian AAII bear/bull ratio (32.77/35.43) and Investors Intelligence Bear/Bull Ratio at 18.5/51.1 (contrary indicator) both saw a rise in bears and dip in bulls and remain neutral and negative respectfully as their enthusiasm waned.
- Valuation finds the forward 12-month consensus earnings estimate from Bloomberg lifting to $206.56 for the SPX. As such, the SPX forward multiple is 21.8 with the “rule of 20” finding fair value at approximately18.7.
- The SPX forward earnings yield is 4.59%.
- The 10-year Treasury yield lifted to 1.34%. We view resistance as 1.4% with support at 1.23%. We reiterate the recent shift of the 10-year yield into a higher trading range could cause some issues for the markets.
In conclusion, no evidence was presented yesterday that would suggest a change in our current “{neutral/positive” macro-outlook for equities would be warranted.
SPX: 4,440/NA DJI: 35,000/35,495 COMPQX: 14,800/NA NDX: 15,094/NA
DJT: 14,582/14,820 MID: 2,699/2,754 RTY: 2,200/2,260 VALUA: 9,485/9,708
Source for all charts below: Worden.
S&P 500 Daily Chart
Dow Jones Industrials
NASDAQ Composite
NASDAQ 100
Dow Jones Transports
S&P Midcap 400
Russell 2000
Trading in financial instruments and/or cryptocurrencies involves high risks including the risk of losing some, or all, of your investment amount, and may not be suitable for all investors. Prices of cryptocurrencies are extremely volatile and may be affected by external factors such as financial, regulatory or political events. Trading on margin increases the financial risks.
Before deciding to trade in financial instrument or cryptocurrencies you should be fully informed of the risks and costs associated with trading the financial markets, carefully consider your investment objectives, level of experience, and risk appetite, and seek professional advice where needed.
Fusion Media would like to remind you that the data contained in this website is not necessarily real-time nor accurate. The data and prices on the website are not necessarily provided by any market or exchange, but may be provided by market makers, and so prices may not be accurate and may differ from the actual price at any given market, meaning prices are indicative and not appropriate for trading purposes. Fusion Media and any provider of the data contained in this website will not accept liability for any loss or damage as a result of your trading, or your reliance on the information contained within this website.
It is prohibited to use, store, reproduce, display, modify, transmit or distribute the data contained in this website without the explicit prior written permission of Fusion Media and/or the data provider. All intellectual property rights are reserved by the providers and/or the exchange providing the data contained in this website.
Fusion Media may be compensated by the advertisers that appear on the website, based on your interaction with the advertisements or advertisers.