Charts And Breadth Weaken Further
Guy S. Ortmann, CMT | Sep 13, 2021 09:26AM ET
McClellan 1-Day OB/OS Oscillators Still Neutral
All the major equity indexes closed lower Friday with negative internals on the NYSE and NASDAQ as NYSE volumes dipped and NASDAQ volumes rose from the prior session. All closed at or near their intraday lows as the early session strength evaporated.
The charts saw further deterioration with several violations of support as some near-term trends turned negative. As well, market breadth weakened further, leaving all the cumulative advance/decline lines in downtrends.
Regarding the data, we are not seeing any indications at this point suggesting the current correction has climaxed as the McClellan 1-day OB/OS Oscillators remain neutral while other data points have yet to reverse their cautionary signals. So, although the futures again indicate a strong open, as they did on Friday, they suggest an open near important resistance levels that would need to be violated in order to alter our current near-term “neutral” macro-outlook for equities.
On the charts, all the major equity indexes closed lower Friday with negative internals on the NYSE and NASDAQ with all closing at or near their intraday lows.
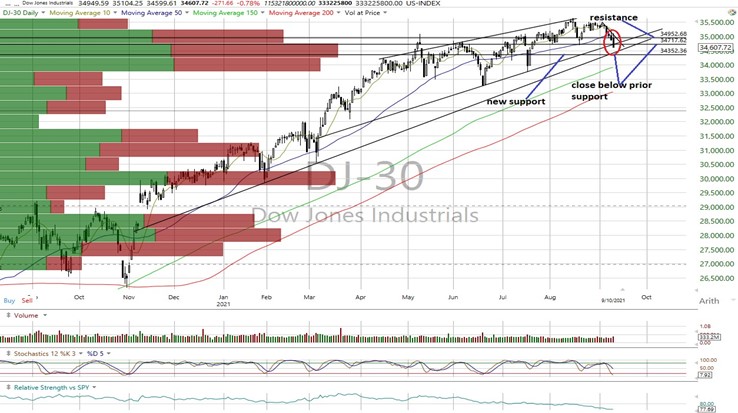
- The charts weakened further with the DJI, MID, RTY, and VALUA all closing below their near-term support levels and are now in bearish near-term trends.
- As well, the MID and VALUA closed below their 50 DMAs.
- So, we find the DJI, MID, RTY and VALUA near-term negative with the rest neutral.
- The COMPQX and NDX generated bearish stochastic crossovers. Recent weakness in the other indexes was presaged by similar signals.
- Breadth weakened further with the cumulative advance/decline lines for the All Exchange, NYSE and NASDAQ turning negative and below their 50 DMAs.
The data finds the McClellan 1-Day OB/OS Oscillators still in neutral territory, lacking oversold signals (All Exchange: -24.19 NYSE: -36.41 NASDAQ: -16.45).
- The Rydex Ratio (contrarian indicator) measuring the action of the leveraged ETF traders dipped slightly to 1.21 but still finds the ETF traders heavily leveraged long and on a bearish signal.
- The Open Insider Buy/Sell Ratio was unchanged at 23.7 and remains bearish. They have yet to see price as attractive enough for purchase.
- Last week’s contrarian AAII Bear/Bull Ratio and Investors Intelligence Bear/Bull Ratio (contrary indicator) both saw an increase in bears and bulls with the AAII remaining neutral (33.8/38.73) and the II bearish at 21.3/52.1.
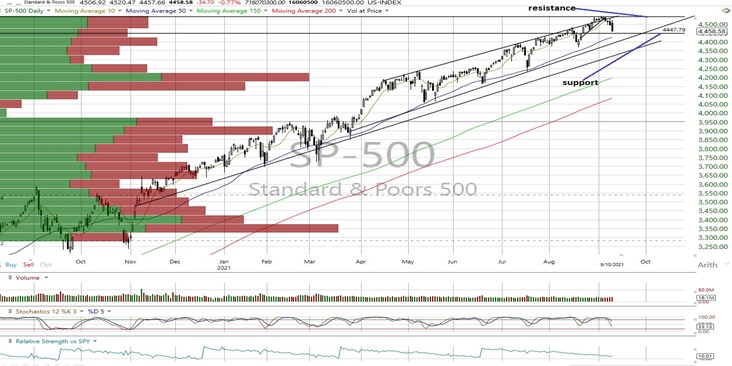
- Valuation finds the forward 12-month consensus earnings estimate from Bloomberg dipping to $207.54 for the SPX. As such, the SPX forward multiple is 21.5 with the “rule of 20” finding fair value at approximately 18.7.
- The SPX forward earnings yield is 4.65%.
- The 10-year Treasury yield rose to 1.34% but remains within its current trading range with resistance at 1.4% and support at 1.23%.
In conclusion, Friday’s failed rally attempt combined with the deterioration of the charts and lack of data encouragement suggest we maintain our “neutral” macro-equity outlook despite the strong futures this morning. We believe more patience may be required to become more optimistic.
SPX: 4,440/4,535 DJI: 34,352/34,953 COMPQX: 14,890/15,379 NDX: 15,265/15,690
DJT: 14,239/14,732 MID: 2,676/2,737 RTY: 2,200/2,280 VALUA: 9,388/9,670
All charts courtesy of Worden
S&P 500
Dow Jones Industrials
NASDAQ Composite
NASDAQ 100
Dow Jones Transports
S&P Midcap 400
Russell 2000 Futures
Trading in financial instruments and/or cryptocurrencies involves high risks including the risk of losing some, or all, of your investment amount, and may not be suitable for all investors. Prices of cryptocurrencies are extremely volatile and may be affected by external factors such as financial, regulatory or political events. Trading on margin increases the financial risks.
Before deciding to trade in financial instrument or cryptocurrencies you should be fully informed of the risks and costs associated with trading the financial markets, carefully consider your investment objectives, level of experience, and risk appetite, and seek professional advice where needed.
Fusion Media would like to remind you that the data contained in this website is not necessarily real-time nor accurate. The data and prices on the website are not necessarily provided by any market or exchange, but may be provided by market makers, and so prices may not be accurate and may differ from the actual price at any given market, meaning prices are indicative and not appropriate for trading purposes. Fusion Media and any provider of the data contained in this website will not accept liability for any loss or damage as a result of your trading, or your reliance on the information contained within this website.
It is prohibited to use, store, reproduce, display, modify, transmit or distribute the data contained in this website without the explicit prior written permission of Fusion Media and/or the data provider. All intellectual property rights are reserved by the providers and/or the exchange providing the data contained in this website.
Fusion Media may be compensated by the advertisers that appear on the website, based on your interaction with the advertisements or advertisers.