Chart Of The Day: With Cisco Now A Buy, Why Are Technicals Signaling A Fall?
Pinchas Cohen | Aug 12, 2019 07:43AM ET
Cisco Systems, the San Jose-based networking products giant, is due to report Q4 2019 results on Wednesday, August 14, after the bell. Expectations are for $1.14 EPS and $2.55 billion in revenue. That's versus $1.76 EPS and $3.12 billion for the corresponding quarter last year.
Over the past six years, Cisco (NASDAQ:CSCO) missed just once on EPS (November 2013) and twice on earnings (November 2018 and February 2019). The company is expected to beat again on Wednesady, after it released a string of upward guidance revisions during the past quarter.
During its previous report, Cisco delivered stronger than expected earnings after the company adjusted prices and worked closely with suppliers to offset the firm reduced its overall China revenue to just 3%.
Nevertheless, shares of Cisco closed up 21% YTD on Friday, barely any better than the +20.79% gains over the same time period from its benchmark index, the NASDAQ 100, where its 2.731% weighting makes it the 7th 'heaviest' of the index's 100 components.
Why has a company that's seemingly pulled out all the stops to offset trade headwinds not been able to markedly outperform its broader index? The technical charts can provide some insight on supply and demand.

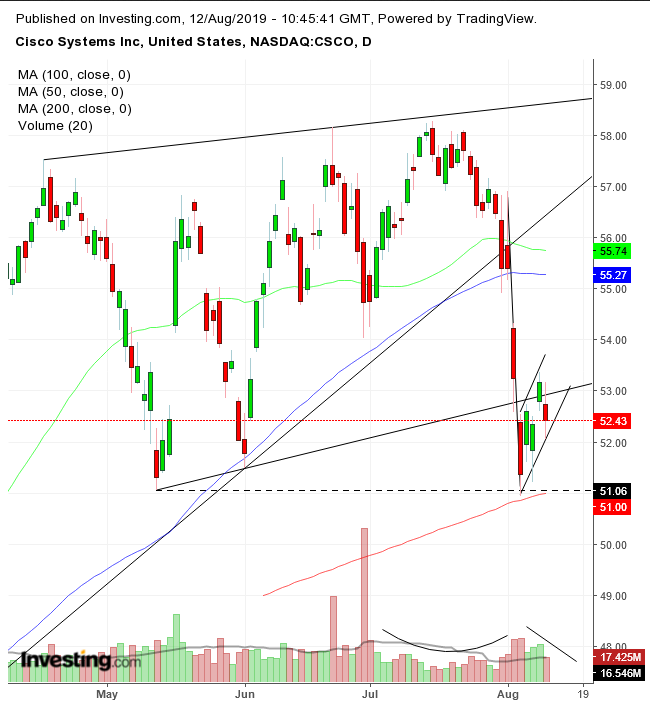
During last Monday's selloff, the stock fell below its rising channel since April, after having already fallen below its uptrend line on July 31, in place since the Christmas-Eve rout. Conversely, its index, the NASDAQ 100, found support off its uptrend line of the same period, bouncing off it and confirming the uptrend.
Moreover, after finding support by the 200 DMA, which realigned with the May lows, the price consolidated with an upward bias. After the double-digit selloff the week before, this rising congestion has all the telltale signs of a setup for another leg in the downturn.
This scenario fits with the technical pattern, a rising flag—bearish after a leg down—subsequent to breaking the support of the channel bottom, whose current resistance was confirmed with Friday’s fall, and before attempting to take on the 200 DMA for the second time. Note the volume as well: it dried up in the previous rally and spiked amid the selloff.
Volume has also been falling against the rising flag, another sign that demand is drying up. This is further evidence of a coming flag pattern completion with a downside breakout.
Why has Cisco not been able to separate away from the sector, despite its greater independence from Chinese revenue? Though we don’t know for sure, an assumption can be made that the company is now hampered by residual negative sentiment, for which Cisco is not at fault.
Or maybe this price action is being driven by informed money, people who may be close to the inner circle and have picked up on negative rumors. Meanwhile, ironically, of 30 analysts, 21 now have a buy rating on the stock, with zero providing a “sell.”
If there's a downside breakout of the flag, however, we'll be the first to call a sell signal.
Trading Strategies
Conservative traders might wait for weekly falling peaks and troughs to establish a long-term downtrend.
Moderate traders could enter a short position after the price falls below the 200 DMA and finds resistance upon a return move.
Aggressive traders might be content to short the stock with a downside breakout below $52.
Entry Sample: Short Setup
Trading in financial instruments and/or cryptocurrencies involves high risks including the risk of losing some, or all, of your investment amount, and may not be suitable for all investors. Prices of cryptocurrencies are extremely volatile and may be affected by external factors such as financial, regulatory or political events. Trading on margin increases the financial risks.
Before deciding to trade in financial instrument or cryptocurrencies you should be fully informed of the risks and costs associated with trading the financial markets, carefully consider your investment objectives, level of experience, and risk appetite, and seek professional advice where needed.
Fusion Media would like to remind you that the data contained in this website is not necessarily real-time nor accurate. The data and prices on the website are not necessarily provided by any market or exchange, but may be provided by market makers, and so prices may not be accurate and may differ from the actual price at any given market, meaning prices are indicative and not appropriate for trading purposes. Fusion Media and any provider of the data contained in this website will not accept liability for any loss or damage as a result of your trading, or your reliance on the information contained within this website.
It is prohibited to use, store, reproduce, display, modify, transmit or distribute the data contained in this website without the explicit prior written permission of Fusion Media and/or the data provider. All intellectual property rights are reserved by the providers and/or the exchange providing the data contained in this website.
Fusion Media may be compensated by the advertisers that appear on the website, based on your interaction with the advertisements or advertisers.