Chart Of The Day: USD/JPY
Blake Morrow | Oct 29, 2020 05:40PM ET
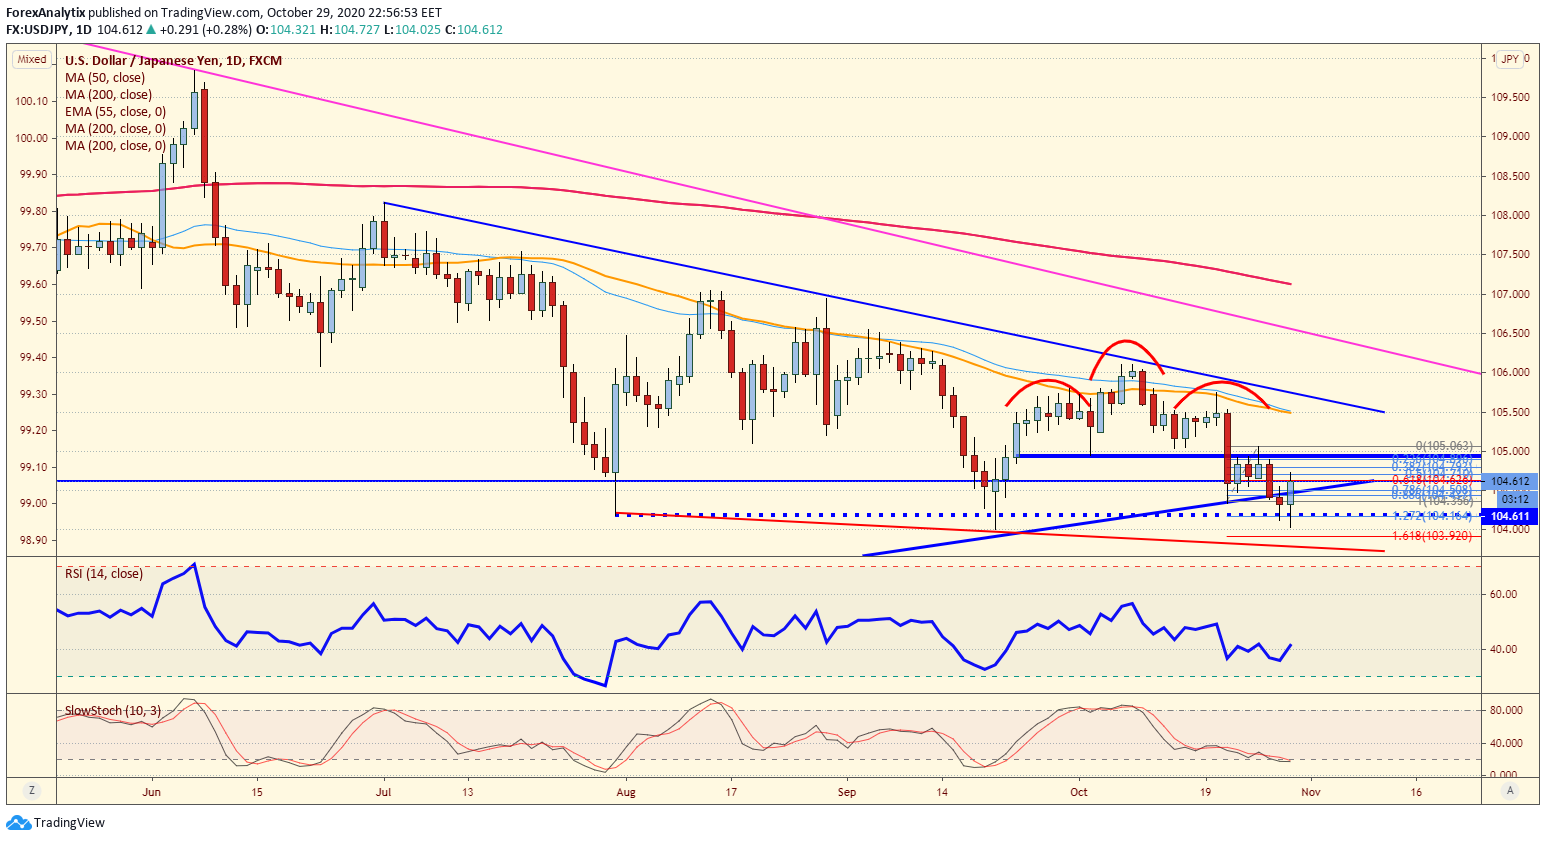
On Oct. 21, USD/JPY was our chart of the day, and overnight we managed to break lower from the triangle formation and get very close to the 104.00 level. By the end of the session, we closed back above the 104.50 level, which should have the bear's attention. The risk of a reversal is high, especially by the end of the week if we close above the 104.50 level. A false breakdown could lead to a breakout (higher) in the weeks ahead. If you look longer term (not pictured), over the last three years USD/JPY dropped close to 104.50 and turned higher immediately except for March of this year due to COVID-19, which took a week or two to turn higher. Knowing that, it is hard to be short USD/JPY down here while above the 104.00 level.
![]()
Trading in financial instruments and/or cryptocurrencies involves high risks including the risk of losing some, or all, of your investment amount, and may not be suitable for all investors. Prices of cryptocurrencies are extremely volatile and may be affected by external factors such as financial, regulatory or political events. Trading on margin increases the financial risks.
Before deciding to trade in financial instrument or cryptocurrencies you should be fully informed of the risks and costs associated with trading the financial markets, carefully consider your investment objectives, level of experience, and risk appetite, and seek professional advice where needed.
Fusion Media would like to remind you that the data contained in this website is not necessarily real-time nor accurate. The data and prices on the website are not necessarily provided by any market or exchange, but may be provided by market makers, and so prices may not be accurate and may differ from the actual price at any given market, meaning prices are indicative and not appropriate for trading purposes. Fusion Media and any provider of the data contained in this website will not accept liability for any loss or damage as a result of your trading, or your reliance on the information contained within this website.
It is prohibited to use, store, reproduce, display, modify, transmit or distribute the data contained in this website without the explicit prior written permission of Fusion Media and/or the data provider. All intellectual property rights are reserved by the providers and/or the exchange providing the data contained in this website.
Fusion Media may be compensated by the advertisers that appear on the website, based on your interaction with the advertisements or advertisers.