Chart Of The Day: Trading Bitcoin Amid Conflicting Technical Signals
Investing.com | Jun 06, 2022 09:26AM ET
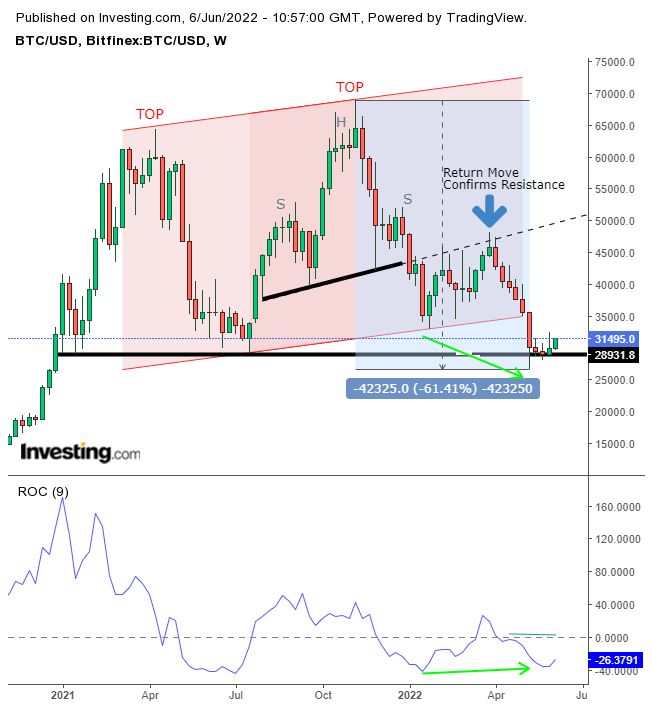
Since November, Bitcoin investors have been on a stomach-churning roller coaster ride. After the largest cryptocurrency by market cap went 'to the moon,' reaching an all-time high of $68,925 per token on Nov. 10, the digital currency immediately reversed, and proceeded to lose 61.4% of value, falling to $26,600 on May 12.
During that period, beginning Apr. 4, Bitcoin also suffered an eight-week consecutive loss, its longest straight decline ever. Now, BTC/USD is rising strong, heading toward its second weekly gain today as it pushes toward the $31,500 per token level.
The current move is causing some to wonder whether the cryptocurrency has bottomed and is starting another bull run . We've also identified some bullish potential on the technical chart.
The current weekly trade is confirming last week's weekly Inverted Hammer. The much lower close last week relative to Bitcoin's intra-week high may include some short positions.
The recent rally would mean these traders are losing money which could trigger a short squeeze that would push the price up higher. Also, the Rate of Change (a momentum indicator more sensitive than the Relative Strength Index or RSI) provided a positive divergence, showing momentum is rising, despite a decline in the price.
However, we're more concerned about price falling out of its Rising Channel since the March 2021 high, following an H&S top. Moreover, the current rise could turn out to only be profit taking by continuous short positions.
On the daily chart, Bitcoin may be developing a Rising Flag, bearish after the whopping 33.5% plunge in just eight sessions between May 4 and the May 12 low, including a five-day straight selloff.
The fact that the flag developed on the very neckline of the enormous Double Top since the April 2021 high compounds its technical potential. Also, the digital coin has been trading within a Falling Channel since its Nov. 10 record high, reinforcing the bearish view.
Still, we can call a flag only upon its downside breakout. Also, calling a flag as the pattern enters its fourth week of development could be pushing it since they generally take between one and three weeks to develop. As such, cautious traders will wait for the decisive breakout.
Trading Strategies
Conservative traders should wait for the downside breakout of the flag and the Double Top, below $28,000, then wait for a return move that will retest at least the neckline of the top if not the flag—which is higher.
Moderate traders would wait for the same downside breakout and the corrective rally to follow for a better entry, if not for confirmation.
Aggressive traders could short now, provided they accept the higher risk that goes along with the higher reward of beating other traders to the punch. Money management is critical. Below we've provided a generic example.
However, if you learn how to incorporate your timing, budget, and temperament into your own plan, chances of success should improve exponentially the more you trade.
Trade Sample – Aggressive Short
- Entry: $32,500
- Stop-Loss: $33,000
- Risk: $500
- Target: $30,000
- Reward: $2,500
- Risk-Reward Ratio: 1:5
Trading in financial instruments and/or cryptocurrencies involves high risks including the risk of losing some, or all, of your investment amount, and may not be suitable for all investors. Prices of cryptocurrencies are extremely volatile and may be affected by external factors such as financial, regulatory or political events. Trading on margin increases the financial risks.
Before deciding to trade in financial instrument or cryptocurrencies you should be fully informed of the risks and costs associated with trading the financial markets, carefully consider your investment objectives, level of experience, and risk appetite, and seek professional advice where needed.
Fusion Media would like to remind you that the data contained in this website is not necessarily real-time nor accurate. The data and prices on the website are not necessarily provided by any market or exchange, but may be provided by market makers, and so prices may not be accurate and may differ from the actual price at any given market, meaning prices are indicative and not appropriate for trading purposes. Fusion Media and any provider of the data contained in this website will not accept liability for any loss or damage as a result of your trading, or your reliance on the information contained within this website.
It is prohibited to use, store, reproduce, display, modify, transmit or distribute the data contained in this website without the explicit prior written permission of Fusion Media and/or the data provider. All intellectual property rights are reserved by the providers and/or the exchange providing the data contained in this website.
Fusion Media may be compensated by the advertisers that appear on the website, based on your interaction with the advertisements or advertisers.