Chart of the Day: S&P 500 Rebounds to Test Key Level
Fawad Razaqzada | Dec 23, 2022 08:04AM ET
- Markets recover after big plunge on Thursday
- Investors eye core PCE
- Lower lows call for caution
The chart to watch is clearly the S&P 500 and other major U.S. indices following Thursday’s big plunge that wiped out two days of gains.
Though the indices finished well off their lows and futures subsequently pushed higher during the Asian session yesterday, more evidence of a bottom is needed if we are to see a Santa rally.
Otherwise, traders must remain very nimble because there could be another rug pull, as we have come to experience this December.
Since faking out above the trend line and resistance around 4100 on Dec. 13, the S&P 500 futures have shown bearish characteristics again.
We have seen the breakdown of the bullish trend line as well as key support around 3915. The two-day rally we saw on Tuesday and Wednesday was wiped out within just a few hours on Thursday as the support around 3840 broke down.
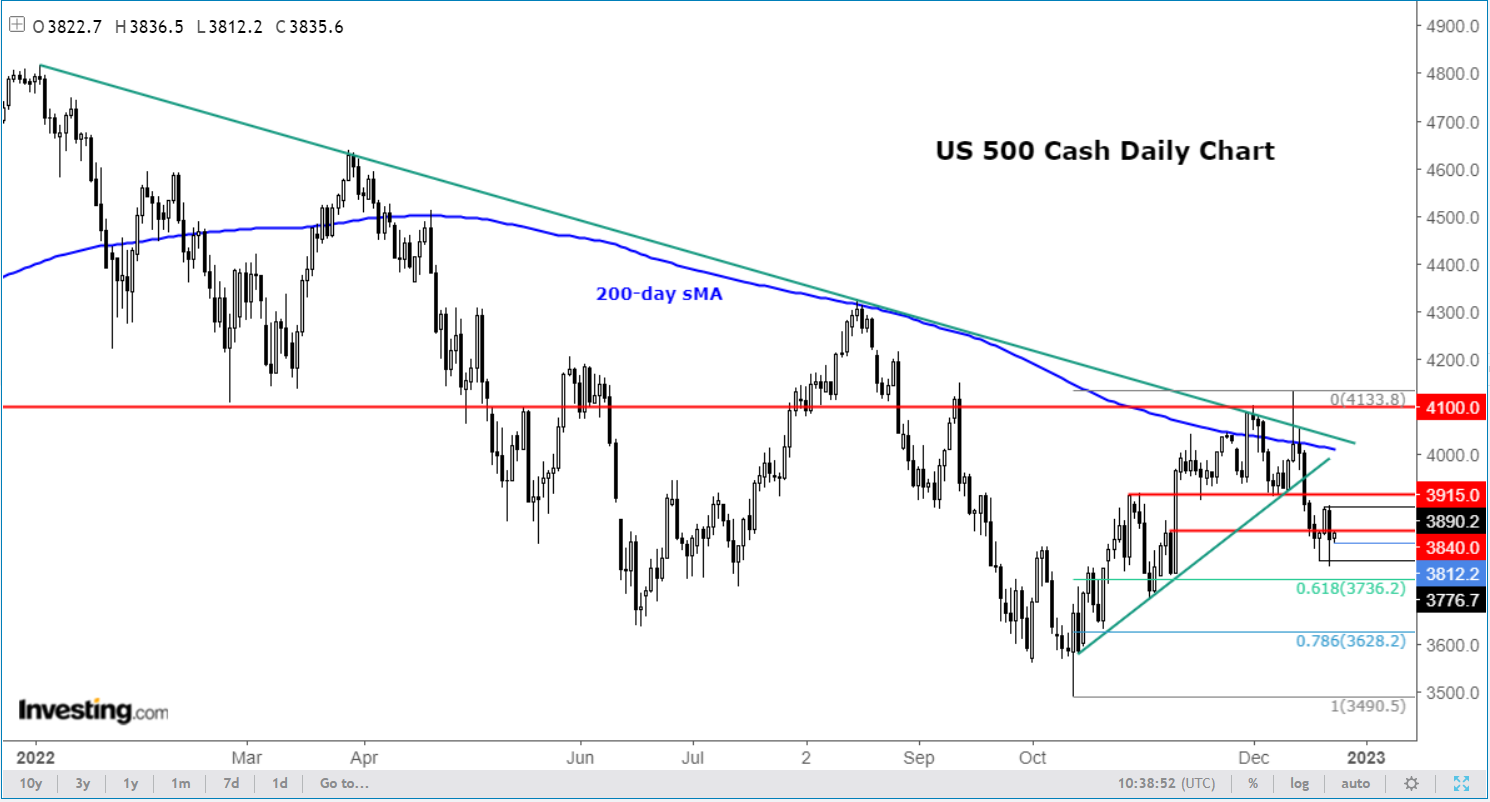
At the time of writing, the index traded near 3840, so let’s see whether the sellers will step in and defend their ground here or step out of the way and let the bulls take charge.
If you are an active trader, it is worth zooming into a lower time frame to find your ideal trade entries around these levels. Given the larger bearish trend, I would look for signs of a bull trap to initiate a short position.
But the size of the recovery from Thursday’s low has been impressive. So, watch out for a reversal pattern on the smaller time frame for confirmation that the index wants to go back down.
As far as today’s macro data is concerned, there is always the possibility for a sharp recovery if the Fed’s preferred inflation gauge, the core PCE price index comes in much weaker than expected.
The index fell to 5% in October from 5.2% in the prior month, in line with market forecasts. This time, it is expected to fall to an annual rate of 4.7%, with a month-over-month reading expected to be +0.2 percent.
But if it comes in hotter than expected, the markets could plunge again. We will also have personal income and spending data, new home sales, and revised UoM sentiment data coming out today.
The economic calendar is very light next week because of the holidays before things pick up again in the first week of January.
Disclosure: The author does not own any of the securities mentioned in this article.
![]()
Trading in financial instruments and/or cryptocurrencies involves high risks including the risk of losing some, or all, of your investment amount, and may not be suitable for all investors. Prices of cryptocurrencies are extremely volatile and may be affected by external factors such as financial, regulatory or political events. Trading on margin increases the financial risks.
Before deciding to trade in financial instrument or cryptocurrencies you should be fully informed of the risks and costs associated with trading the financial markets, carefully consider your investment objectives, level of experience, and risk appetite, and seek professional advice where needed.
Fusion Media would like to remind you that the data contained in this website is not necessarily real-time nor accurate. The data and prices on the website are not necessarily provided by any market or exchange, but may be provided by market makers, and so prices may not be accurate and may differ from the actual price at any given market, meaning prices are indicative and not appropriate for trading purposes. Fusion Media and any provider of the data contained in this website will not accept liability for any loss or damage as a result of your trading, or your reliance on the information contained within this website.
It is prohibited to use, store, reproduce, display, modify, transmit or distribute the data contained in this website without the explicit prior written permission of Fusion Media and/or the data provider. All intellectual property rights are reserved by the providers and/or the exchange providing the data contained in this website.
Fusion Media may be compensated by the advertisers that appear on the website, based on your interaction with the advertisements or advertisers.