Chart Of The Day: Rare Technical Pattern Warns Amazon Sell-Off May Be Near
Investing.com | Dec 16, 2020 09:41AM ET
Amazon.com (NASDAQ:AMZN), already the largest retailer on the planet having surpassed Walmart's (NYSE:WMT) position for that benchmark in the middle of last year, was perfectly situated for this year's global pandemic. With COVID forcing consumers to shelter in place, the Seattle-based e-tail behemoth allowed customers to shop from home without having to violate any lockdown orders.
As such, Amazon stands out in a year of fabulous returns for some stocks.
Given the circumstances, traders see it as a forgone conclusion that the stock will just continue pushing higher. Aside from the increasing adaptation to online shopping, Amazon keeps breaking into new markets while also growing its existing efforts. This includes the company’s recent online pharmacy initiative, its autonomous driving startup Zooks which just unveiled a driverless robotaxi, as well as the growth of Amazon Web Service, the company's cloud business that's now also being used by Twitter (NYSE:TWTR).
Analysts believe that the current economic environment justifies the company's extreme valuation. The stock closed Tuesday at $3,165, up 0.26%, and based on its projected free cash flow, which some analyts believe could average out to $43.7 billion projected out through 2021. 46 analysts who provided a price target on the stock for the next 12 months, have a median target of $3,800 with a high estimate of $4,500.
Though we consider Amazon a solid long-term investment, we believe the company’s 72.5% YTD returns to be a setup for a correction as investors look to take profit on a good thing. That dynamic is also visible in the stock’s trading pattern.
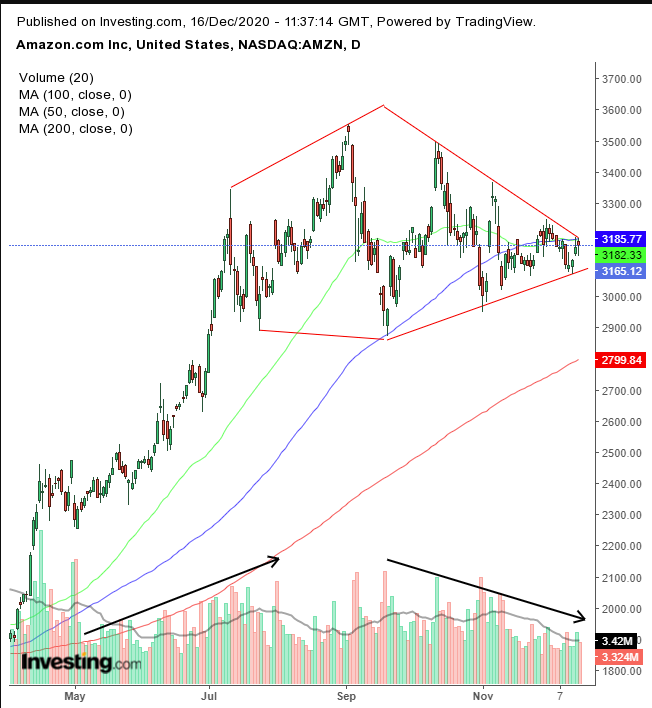
The price appears to be about to break out of a Diamond Top—a combination of a broadening pattern and symmetrical triangle.
This is a rare occuance that, should it appear, almost always takes place at a top, following an extremely sharp price rise. Since its formation requires climactic trading action, it manifests specifically on top, while bottoms tend to be incremental.
Admittedly, March’s sharp V-bottom was an exception. Will that exceptionalism repeat itself now, turning an infrequently seen pattern into a continuation pattern?
While anything is possible, we can only rely on the statistics. The unique environment that forms the pattern’s dynamic, began with wild swings. Those swings preceded an expected large move that never materialized as it turned into a lack of interest due to the cyclical rotation out of technology.
The volume supports the pattern’s implications. It started off with gusto only to fizzle out. Both the 50 and 100 DMAs joined forces with the top of the pattern, revealing the price at this time to be a technical pressure point. If the price breaks through the pattern’s top, it will have blown the pattern’s bearish bias, forcing traders to recalibrate, turning the pattern bullish.
However, yesterday’s hanging man—at this crucial nexus of different technical forces—increases the odds of a bearish confirmation, with a close below the hanging man’s real body (opening-to-closing price). This therefore suggests a downside breakout, in which the 50 and 100 DMAs send the price toward the 200 DMA which is considerably lower.
The pattern’s implied target, obtained by measuring its height—whose interested parties are expected to repeat their moves if they were right, and negate them if they were wrong—puts the stock in the direction of $2,000 rather than the $4,000 range.
Remember, though, that signal is only applicable upon a decisive downside breakout. If it's impossible to see that happening? Consider the ramifications of the EU's current antitrust lawsuit against the company.
Trading Strategies
Conservative traders should wait for a downside breakout of the pattern, with a close below the $3,000 psychological round number, followed by a return move, whose resistance would verify the pattern’s integrity.
Moderate traders might be content with a close below the Dec. 11 low of $3,072.
Aggressive traders may short now, given the attractive risk-reward ratio thanks to the price’s proximity to the pattern top.
Trade Sample
- Entry: $3,180
- Stop-Loss: $3,200
- Risk: $20
- Target: $3,120
- Reward: $60
- Risk:Reward Ratio: 1:3
Trading in financial instruments and/or cryptocurrencies involves high risks including the risk of losing some, or all, of your investment amount, and may not be suitable for all investors. Prices of cryptocurrencies are extremely volatile and may be affected by external factors such as financial, regulatory or political events. Trading on margin increases the financial risks.
Before deciding to trade in financial instrument or cryptocurrencies you should be fully informed of the risks and costs associated with trading the financial markets, carefully consider your investment objectives, level of experience, and risk appetite, and seek professional advice where needed.
Fusion Media would like to remind you that the data contained in this website is not necessarily real-time nor accurate. The data and prices on the website are not necessarily provided by any market or exchange, but may be provided by market makers, and so prices may not be accurate and may differ from the actual price at any given market, meaning prices are indicative and not appropriate for trading purposes. Fusion Media and any provider of the data contained in this website will not accept liability for any loss or damage as a result of your trading, or your reliance on the information contained within this website.
It is prohibited to use, store, reproduce, display, modify, transmit or distribute the data contained in this website without the explicit prior written permission of Fusion Media and/or the data provider. All intellectual property rights are reserved by the providers and/or the exchange providing the data contained in this website.
Fusion Media may be compensated by the advertisers that appear on the website, based on your interaction with the advertisements or advertisers.