Chart Of The Day: Bitcoin Hit With Triple Bearish Pattern
Investing.com | Jul 06, 2020 10:03AM ET
Bitcoin has been stagnant for over a month, since hitting a high of $10,390 on June 1. For technicians, this lethargy has persisted for even longer, since late April.
Yes, the digital currency did make higher highs up until June 1, but that was mostly churning. Indeed, the gains were insignificant compared with the wild 80% surge from the March lows to the Apr. 30 peak.
Maybe Bitcoin—which some consider a safe haven—is down, given the risk-on sentiment driving the markets. After all, the S&P 500 has gained 2.4% since June 1.
If that were the case, it should make the cryptocurrency the most sensitive to risk. But Bitcoin has fallen by 11.3% since June 1, while gold, perhaps the ultimate safe haven, is up 2% in the same period, as is the Swiss franc. The dollar is down 0.9%, while US yields and the yen are flat.
We have a confession: when the emergence of COVID-19 terrified everyone, and stocks were crashing, we were sure Bitcoin would soar. People didn’t want to physically touch money, generally the most circulated asset during a global pandemic. They didn’t even want to leave their homes. So a surge in online banking should have put crypto assets at the forefront.
But that didn’t happen. Instead, Bitcoin fell along with stocks and jumped when equities rebounded. Only now, after stocks have broken out of their respective areas of congestion, the digital currency seems to have been left behind, developing back-to-back bearish patterns on the charts and setting up for a completion of a major reversal.
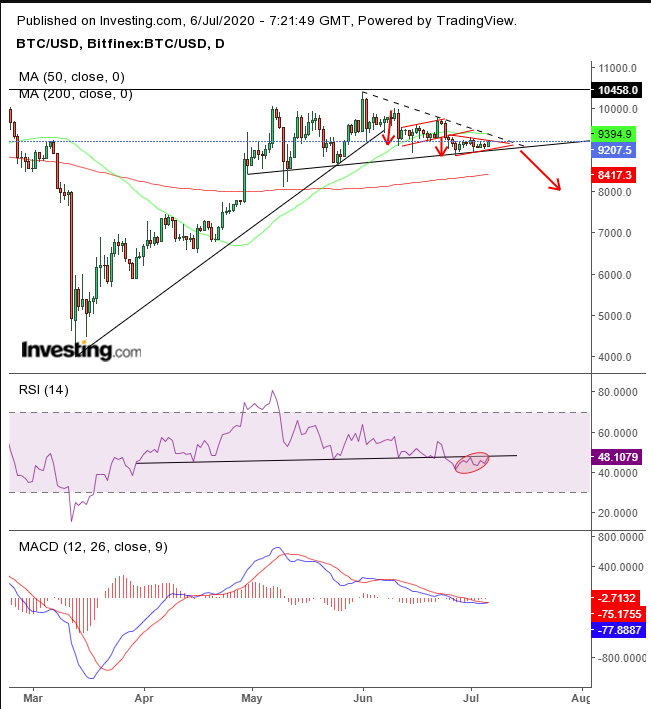
To begin with, Bitcoin fell below its uptrend line since the March lows. The plunge then provided the breeding ground for a rising flag, whose breakout was the setup for a bearish pennant, whose breakout would complete a H&S top. By our count that's three bearish signals in a row.
Both the rising flag and pennant are bearish following these gyrations in price. Investors want to secure their wins, while figuring out the next moves—for both the asset and their trades.
This brief pause in the underlying downtrend allows a fresh crop of bears to pick up where the earlier bears relinquished their positions. When that period of exchanges is over, the breakout occurs, in the direction of the underlying downtrend. This signals that whoever wanted out is out and whoever remained is here to ride the next leg down.
Sellers lower their bids, in an effort to find buyers that are only willing to come in at what they consider a worthwhile price. That’s how they break out of the pattern. What follows is a market chain-reaction of triggered shorts and long liquidation.
This drop can be interrupted by a short squeeze, which would inject temporary demand and boost the price back toward the pattern. But a market that is presumably tilted towards supply would drown out that demand and push prices back down to their last lows, and then lower still. In technical jargon, the breakout was followed by a return-move that “retested” the resistance of the pattern.
The pennant reached only about half of the flag’s target. Should it achieve its target, it will have completed the H&S top.
The pennant is a secondary indicator whose implied target confirms, and therefore reinforces, the flag’s implied target, making a downside breakout to the H&S pattern all the more likely. And that pattern is larger, and more significant, with a much deeper implied target of at least $8,000.
Note, the RSI already completed its H&S top from the perspective of momentum. It even provided a return move that successfully retested resistance.
The MACD, too, provided its version of a downside breakout, falling below 0, already on the flag breakout. The indicator, which compares different price averages, has been providing a sell signal since giving up its July 1 highs, and even before developing the flag—the first of the two continuation patterns.
Trading Strategies
Conservative traders should wait for a downside breakout of the H&S top that pierces the 200 DMA on a closing basis, and which remains below the neckline for at least 3 days (ideally, to include the weekend), if not the 200 DMA. They would then wait for a return move that successfully retests the broken neckline. Resistance here would demonstrate there is continued supply.
Moderate traders may also prefer to wait for a fall below the 200 DMA, with at least a two-day period in which the price remains below the neckline, if not below the 200 DMA. Then, they would wait for the corrective rally for a better point of entry, rather than for proof of the trend.
Aggressive traders may short upon the breakout, thereby increasing the odds of avoiding a bear trap if they wait for a close below the pennant’s June 27, $8,857.30 low. They might wish to employ at least a one-day filter and wait for a return move if they don’t want to risk a wide stop-loss.
Trade Sample – Aggressive Short
- Entry: 9,000
- Stop-Loss: 9,250 - above pennant top
- Risk: 250
- Target: 8,000
- Reward: 1,000
- Risk-Reward Ratio: 1:4
Trading in financial instruments and/or cryptocurrencies involves high risks including the risk of losing some, or all, of your investment amount, and may not be suitable for all investors. Prices of cryptocurrencies are extremely volatile and may be affected by external factors such as financial, regulatory or political events. Trading on margin increases the financial risks.
Before deciding to trade in financial instrument or cryptocurrencies you should be fully informed of the risks and costs associated with trading the financial markets, carefully consider your investment objectives, level of experience, and risk appetite, and seek professional advice where needed.
Fusion Media would like to remind you that the data contained in this website is not necessarily real-time nor accurate. The data and prices on the website are not necessarily provided by any market or exchange, but may be provided by market makers, and so prices may not be accurate and may differ from the actual price at any given market, meaning prices are indicative and not appropriate for trading purposes. Fusion Media and any provider of the data contained in this website will not accept liability for any loss or damage as a result of your trading, or your reliance on the information contained within this website.
It is prohibited to use, store, reproduce, display, modify, transmit or distribute the data contained in this website without the explicit prior written permission of Fusion Media and/or the data provider. All intellectual property rights are reserved by the providers and/or the exchange providing the data contained in this website.
Fusion Media may be compensated by the advertisers that appear on the website, based on your interaction with the advertisements or advertisers.