Can You Minimize Regret By Analyzing Return Distributions?
James Picerno | Jul 10, 2019 07:54AM ET
In the grand scheme of investing, the behavioral risk is second to none on the list of pitfalls that threaten to derail the best-laid plans for investing. The challenge is especially acute in the thankless task of trying to anticipate how you’ll react when a rough patch arrives. The mystery is all the deeper if your only experience with a fund or strategy is holding it during a bull market. There are no easy solutions to this problem, but you can start to chip away at the uncertainty with a simple round of econometric analysis that focuses on return distributions.
Alpha Architect’s Wes Gray describes this technique as “one way to assess the behavioral challenge.” Although he uses distributions in the article to analyze a trend-following strategy for several country benchmarks, the concept can be applied to any portfolio. As an example, let’s run the numbers on a pair of simple stock/bond strategies.
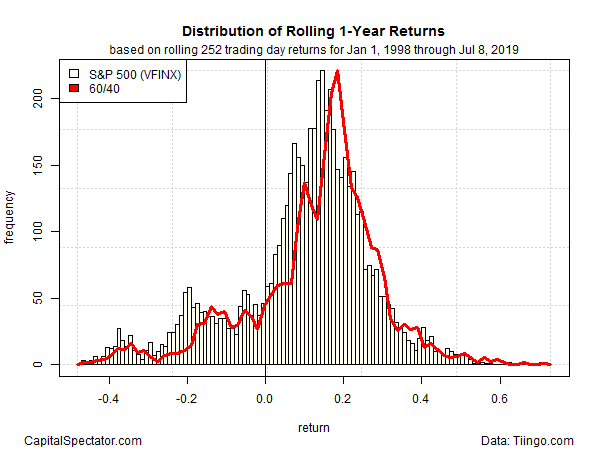
For a benchmark, let’s use the US stock market, based on the Vanguard 500 Index Fund (VFINX). In this toy example, the goal is to consider how a 60% stocks/40% bonds mix will fare against the benchmark. In particular, how will the results diverge? Presumably, the stock/bond strategy will be smoother. Let’s put some hard numbers to the test by studying the past and comparing VFINX with the 60%/40% portfolio.
To build the stock/bond strategy we’ll use VFINX for the 60% equity weight and Vanguard Total Bond Market (VBMFX) to represent the 40% allocation to US fixed income. The start date is the end of 1998, with year-end rebalancing to the target weights. In the interest of brevity, we’ll limit the analysis to rolling one-year returns for the past two decades, although in practice you should consider longer time windows and earlier start dates.
In the first chart below, it’s clear that the 60/40 strategy (red line) offers a degree of improvement over a straight buy-and-hold investment in US equities (VFINX). The 60/40 portfolios suffer a lower frequency of one-year losses while the distribution of gains tends to match/exceed the stock market’s results. In short, this looks like a win-win situation, assuming your focus is on rolling one-year periods (and you’re willing to take a leap of faith and accept the past 20 years as gospel).
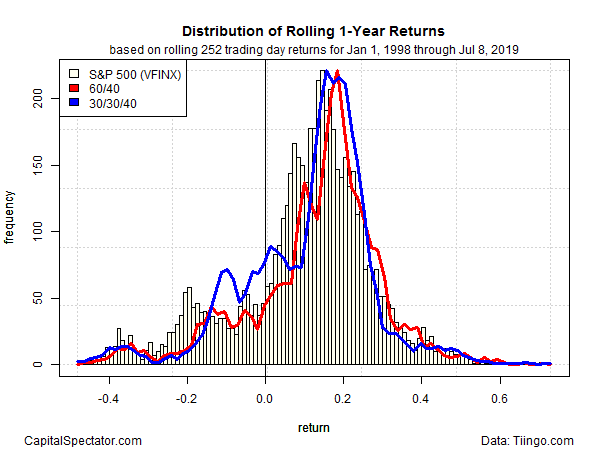
Can we do better? Probably, although the possibilities are endless. Where to start? For an illustration, let’s consider one other possibility: splitting the 60% equity allocation evenly between US and foreign funds via 30% in VFINX and 30% in Vanguard Total International Stock (VGTSX), with the 40% bond weight remaining in VBMFX. We’ll label this strategy: 30/30/40. As before, the portfolio is rebalanced to the target weights every December 31.
The results, shown by the blue line in the next chart below, remind that adding foreign equities has been a drag on performance vs. a US-only focus in recent years. Indeed, the 30/30/40 strategy posted a moderately higher frequency of one-year losses with similar results (at best) for the frequency of gains.
Finally, let’s review the distribution of the performance spread for the 60/40 and 30/30/40 strategies. The third chart below reflects the rolling one-year returns for 30/30/40 less 60/40. This view offers a relative comparison of the two strategies via a one-year prism. Another way to think about the chart below: it quantifies the differences in the red and blue lines in the chart above.
The main takeaway in the chart below: the one-year return distribution is skewed to the left (negative returns). In other words, there’s a bias for underperformance for the 30/30/40 strategy relative to 60/40.
It’s short-sighted to assume that international equity allocations will continue to be a drag on performance. But if we were confident that the past 20 years was a reliable gauge of the future (a heroic assumption in this case), the charts above suggest that sticking with the 60/40 mix will offer a smoother ride and stronger returns.
Granted, studying a 60/40 strategy through a return-distribution lens doesn’t offer a deep level of perspective beyond intuition. All the more so by limiting the analysis to one-year returns. But profiling performance through distributions for more sophisticated strategies is more likely to turn up surprising insights. Indeed, the more you dive into customized asset allocation and use a broader set of asset classes, the less you know about the return distribution – until you start crunching the numbers.
In fact, you can and should run distribution analysis for risk metrics too. Reviewing how volatility, Sharpe ratio, Sortino ratio, etc. stack up can help minimize the ambiguity of how a given strategy will perform in the future from a risk perspective. And if you’re truly ambitious, you can also generate expected returns and risk data as inputs for distribution analysis.
Alas, it’s still impossible to predict the future. But by laying out distributions on return and risk for a strategy, you can estimate how the portfolio could vary going forward. In turn, you’ll have some data to explore for trying to predict if you’ll be able to stay the course – or not — when the road turns rocky.
Trading in financial instruments and/or cryptocurrencies involves high risks including the risk of losing some, or all, of your investment amount, and may not be suitable for all investors. Prices of cryptocurrencies are extremely volatile and may be affected by external factors such as financial, regulatory or political events. Trading on margin increases the financial risks.
Before deciding to trade in financial instrument or cryptocurrencies you should be fully informed of the risks and costs associated with trading the financial markets, carefully consider your investment objectives, level of experience, and risk appetite, and seek professional advice where needed.
Fusion Media would like to remind you that the data contained in this website is not necessarily real-time nor accurate. The data and prices on the website are not necessarily provided by any market or exchange, but may be provided by market makers, and so prices may not be accurate and may differ from the actual price at any given market, meaning prices are indicative and not appropriate for trading purposes. Fusion Media and any provider of the data contained in this website will not accept liability for any loss or damage as a result of your trading, or your reliance on the information contained within this website.
It is prohibited to use, store, reproduce, display, modify, transmit or distribute the data contained in this website without the explicit prior written permission of Fusion Media and/or the data provider. All intellectual property rights are reserved by the providers and/or the exchange providing the data contained in this website.
Fusion Media may be compensated by the advertisers that appear on the website, based on your interaction with the advertisements or advertisers.