Can Bitcoin Bulls Overcome The 200-day EMA?
INVESLO TEAM | Mar 03, 2022 06:55AM ET
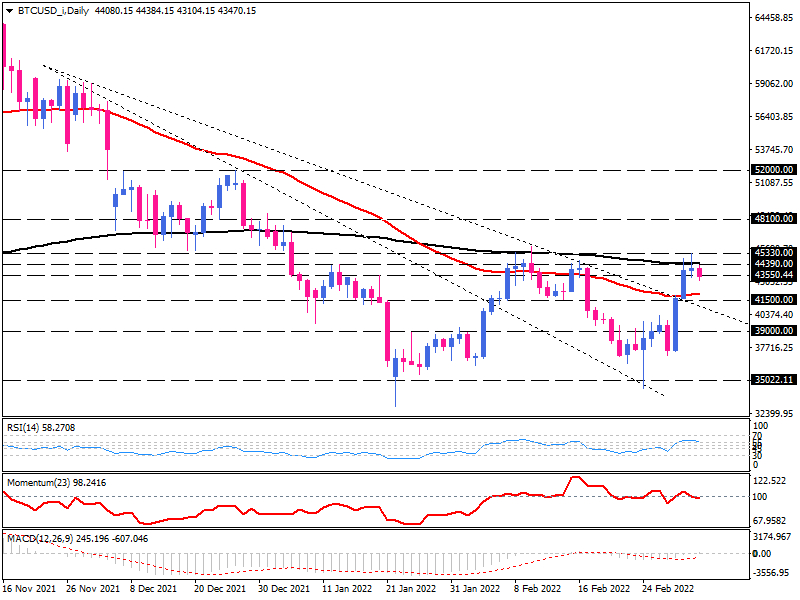
On the daily chart, Bitcoin is trading sideways. After bottoming around $35,000, then pulling back to the broken trend line, buyers also penetrated the less sloping trend line. But the 200-day exponential moving average halted the upward movement earlier this week.
Yesterday's shooting star formation indicates the rejection of higher prices at the confluence of the $44,390 resistance level and the 200-day EMA. In the mid-day European trading session, sellers attempt to drag the price below yesterday's low of $43,550.
With a substantial downward move below this level, they will aim for the 50-day EMA coincides with 41,500 dollars. A further decline below this hurdle may penetrate the descending trend line. If that happens, the $39,000 level may be the following support.
The broad picture of bitcoin is bearish because it is trading below the slow-moving average. Still, the continuation of the long-term downtrend is subject to price dropping below the last bottom at $35,000. Otherwise, should buyers successfully keep above the 200-day EMA, the completion of a double-bottom pattern will be evident. If that's the case, the immediate resistance is at $48,100.
Momentum oscillators convey selling forces are waning. RSI and momentum have posted a divergence between the price and oscillator. At the same time, MACD has crossed above the zero line into buying territory.
Short-Term Outlook
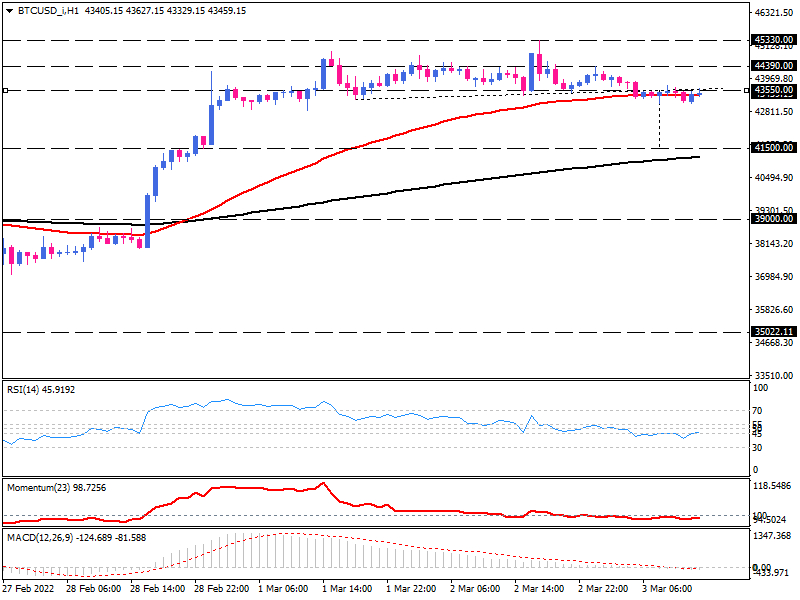
Looking at the short-term time frame on the hourly chart, we see the market sentiment is about to turn bearish by forming a Head and Shoulders pattern. Seemingly, more sellers may cue the broken neckline and crossover the 50-EMA. Once more, the classic projection of the head and shoulder roughly lines up with $41,500 near the 200-EMA.
On the flip side, a sustained move above the right shoulder at $44,390 will invalidate the reversal and may put $45,330 on the buyers' radar. Short-term momentum oscillators indicate a prevailing bearish bias. RSI is trending down, pulling the neutral zone into the selling area.
Meanwhile, momentum is moving below 100-threshold. And MACD bars are dipping below the zero line, while the signal line has also entered the negative territory.
Trading in financial instruments and/or cryptocurrencies involves high risks including the risk of losing some, or all, of your investment amount, and may not be suitable for all investors. Prices of cryptocurrencies are extremely volatile and may be affected by external factors such as financial, regulatory or political events. Trading on margin increases the financial risks.
Before deciding to trade in financial instrument or cryptocurrencies you should be fully informed of the risks and costs associated with trading the financial markets, carefully consider your investment objectives, level of experience, and risk appetite, and seek professional advice where needed.
Fusion Media would like to remind you that the data contained in this website is not necessarily real-time nor accurate. The data and prices on the website are not necessarily provided by any market or exchange, but may be provided by market makers, and so prices may not be accurate and may differ from the actual price at any given market, meaning prices are indicative and not appropriate for trading purposes. Fusion Media and any provider of the data contained in this website will not accept liability for any loss or damage as a result of your trading, or your reliance on the information contained within this website.
It is prohibited to use, store, reproduce, display, modify, transmit or distribute the data contained in this website without the explicit prior written permission of Fusion Media and/or the data provider. All intellectual property rights are reserved by the providers and/or the exchange providing the data contained in this website.
Fusion Media may be compensated by the advertisers that appear on the website, based on your interaction with the advertisements or advertisers.