Calculating The New VIX
Vance Harwood | Nov 12, 2014 02:49PM ET
The chart below graphically represents the calculation for the VIX® and the legacy VIX (ticker VIXMO), which was used from September 22, 2003 through October 5, 2014. The actual VIX is located on the black dotted line in the left center of the graph. Click here for a larger snapshot for 12-Nov-2014. The VIX now uses an interpolation between two VIX-style calculations (VIN and VIF) on SPX options series that are a week apart -- bracketing the 30-day target horizon of the VIX. The legacy calculation uses SPX monthly options (now published as VINMO and VIFMO), which requires significantly longer interpolation/extrapolation periods.
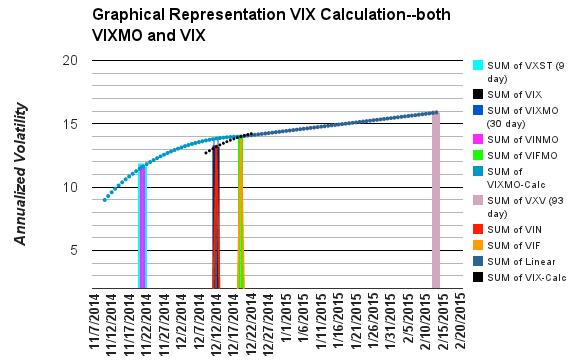
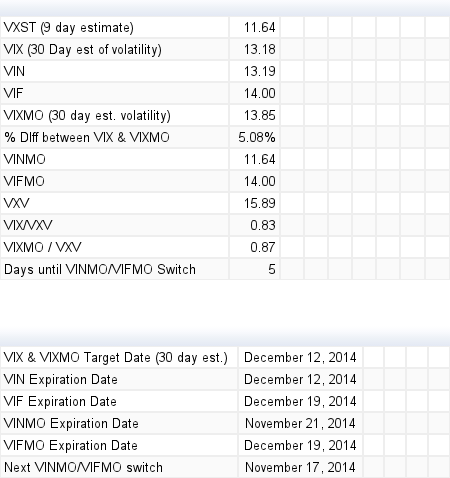
Since its inception on October 6, 2014 the new VIX has often differed significantly from the older calculation, often running 5% or more lower than the legacy number. This is disconcerting and I initially wondered if the reduced volume/open interest of the SPX weekly options used in the new calculation or some other factor was distorting things, but as I look at the data I’m becoming comfortable with the new calculation as a significant improvement in the accuracy of the index.
The VXV is the CBOE’s 93 day version.
There are two somewhat parallel markets associated with general USA market volatility: the S&P 500 (SPX) options market and the VIX Futures market. SPX option prices are used to calculate the CBOE’s family of volatility indexes, with the VIX® being the flagship. VIX futures are priced directly in expected volatility for contracts expiring up to 9 months out. The nearest VIX Future synchronizes with the VIX once a month -- on its expiration date.
Additional resources:
- VIX Futures’ timescape and historical data: VIX Central
- VIX style indexes and term structure for SPX option expirations up to 2½ years out: CBOE
- The Volatility Watcher’s Toolkit
- Trading VIX Options
The dynamically updated chart above uses delayed quotes from Yahoo Finance. For more information on these VIX calculations see Calculating the VIXMO .
Trading in financial instruments and/or cryptocurrencies involves high risks including the risk of losing some, or all, of your investment amount, and may not be suitable for all investors. Prices of cryptocurrencies are extremely volatile and may be affected by external factors such as financial, regulatory or political events. Trading on margin increases the financial risks.
Before deciding to trade in financial instrument or cryptocurrencies you should be fully informed of the risks and costs associated with trading the financial markets, carefully consider your investment objectives, level of experience, and risk appetite, and seek professional advice where needed.
Fusion Media would like to remind you that the data contained in this website is not necessarily real-time nor accurate. The data and prices on the website are not necessarily provided by any market or exchange, but may be provided by market makers, and so prices may not be accurate and may differ from the actual price at any given market, meaning prices are indicative and not appropriate for trading purposes. Fusion Media and any provider of the data contained in this website will not accept liability for any loss or damage as a result of your trading, or your reliance on the information contained within this website.
It is prohibited to use, store, reproduce, display, modify, transmit or distribute the data contained in this website without the explicit prior written permission of Fusion Media and/or the data provider. All intellectual property rights are reserved by the providers and/or the exchange providing the data contained in this website.
Fusion Media may be compensated by the advertisers that appear on the website, based on your interaction with the advertisements or advertisers.