CAD/JPY Double Top Nearing Completion
Blackwell Global | Jan 12, 2017 12:23AM ET
Key Points:
- Double top beginning to become apparent.
- MACD and Parabolic SAR switching bias towards bearish.
- 100 day EMA likely to cap downsides to some extent.
The CAD/JPY is looking ripe for a tumble within the next few weeks and these losses could be fairly substantial if the developing chart pattern comes to pass. However, aside from this nascent double top structure, there are a number of other technical signals hinting that we might see the pair move back towards the lower end of the prior year’s range. As a result, it’s worth taking a closer look at the changing bias of this only recently relentlessly bullish exotic cross.
First and foremost, it is fairly patent that a likely double top formation is developing around the 12 month high. And whilst, yes, we do still need to see the CAD/JPY move back to the neckline around the 23.6% Fibonacci level to confirm the pattern, it is presently looking fairly certain that the whole structurewill form. Indeed, the pair has proven quite resistant to recent attempts to push it higher and it has been making steady progress towards the vital 85.98 level.
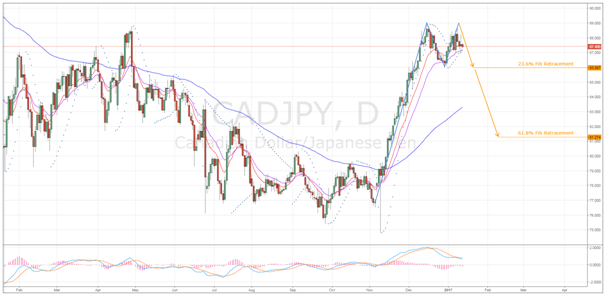
Notably, there are a number of technical signals beginning to shift the overall bias for the pair to bearish which should help the forecasted retracements to be borne out. Firstly, the MACD oscillator has just experienced a signal line crossover which typically precedes a change in momentum for a pair. Moreover, the imminent shift in the Parabolic SAR is also important as it is on the cusp of signalling that a medium-term change in bias is likely to be next on the agenda for the CAD/JPY.
As a result of these combined technical signals, a slip looks like a fairly likely prospect. However, just how far we can expect the pair to tumble is somewhat more ambiguous. Whilst a plunge back to the base of the overall double top pattern would be the normal resolution to this particular structure, such a plummet might be a little overambitious. Specifically, the 100 day EMA will almost certainly work to cap downside risks around the 83.00 handle so, at a stretch, we might see the 61.8% Fibonacci level tested in the given timeframe. A move to this level would bring the CAD/JPY back to the lower end of its trade range from the prior 12 months.
Ultimately, keep an eye on the pair as it approaches the neckline of the double top and also monitor the fundamentals for any surprise outcomes which might spark a downside breakout. In particular, the BoC is announcing the Overnight Rate shortly which, even if it is held steady, could produce enough volatility to kick start the forecasted slip.

Trading in financial instruments and/or cryptocurrencies involves high risks including the risk of losing some, or all, of your investment amount, and may not be suitable for all investors. Prices of cryptocurrencies are extremely volatile and may be affected by external factors such as financial, regulatory or political events. Trading on margin increases the financial risks.
Before deciding to trade in financial instrument or cryptocurrencies you should be fully informed of the risks and costs associated with trading the financial markets, carefully consider your investment objectives, level of experience, and risk appetite, and seek professional advice where needed.
Fusion Media would like to remind you that the data contained in this website is not necessarily real-time nor accurate. The data and prices on the website are not necessarily provided by any market or exchange, but may be provided by market makers, and so prices may not be accurate and may differ from the actual price at any given market, meaning prices are indicative and not appropriate for trading purposes. Fusion Media and any provider of the data contained in this website will not accept liability for any loss or damage as a result of your trading, or your reliance on the information contained within this website.
It is prohibited to use, store, reproduce, display, modify, transmit or distribute the data contained in this website without the explicit prior written permission of Fusion Media and/or the data provider. All intellectual property rights are reserved by the providers and/or the exchange providing the data contained in this website.
Fusion Media may be compensated by the advertisers that appear on the website, based on your interaction with the advertisements or advertisers.