Boom-Bust Cycle Update
Steve Saville | Oct 04, 2021 12:25AM ET
There are two things that always happen at or prior to the start of a boom-to-bust transition for the US economy. One is a clear-cut widening of credit spreads and the other is pronounced weakness in the Industrial Metals Index (GYX) relative to the gold price.
These indicators have sometimes warned incorrectly that a bust was about to begin, but they have never failed to signal an actual boom-to-bust transition in a timely manner. Below are charts showing the current positions of these reliable boom-bust indicators.
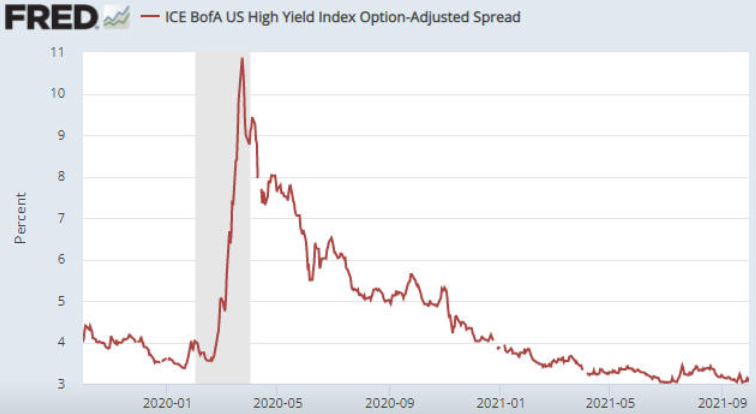
The first chart shows the ICE BofA US High Yield Option-Adjusted Spread (HYIOAS), a good indicator of US credit spreads.
In early-July of this year the HYIOAS was at its lowest level in more than 10 years and not far from an all-time low. It spiked upward around the middle of July, but it has since returned to near its low. This means that credit spreads in the US remain close to their narrowest levels ever.
Note that a credit-spread reversal would be signaled by the HYIOAS making a higher short-term high AND moving back above 4%. The first of these criteria (the initial warning) would be triggered by a move above 3.5%.
The next chart shows the GYX/gold ratio. To generate a boom-to-bust warning the line on this chart would have to move below its 200-day moving average, but currently it is in a clear-cut upward trend and not far from its cycle high.
Clearly, neither of the indicators that in the past have always warned prior to the start of a boom-to-bust transition for the US economy is close to triggering. This means that the economic boom* that began during the second quarter of 2020 remains in full swing. Furthermore, as things currently stand it looks like the start of a boom-to-bust transition is at least six months away.
For long-side speculations and investments, during the boom phase of the cycle it’s important to emphasize assets and commodities that do well during booms. For example, industrial commodities (e.g., energy, base metals, lithium, rare-earths) generally should be favored over gold during the boom phase, with the opposite applying during the bust phase. This may seem like a statement of the bleeding obvious, but a lot of market participants stay bullish on certain investments and bearish on others regardless of whether the economy is in the boom phase or the bust phase.
*An economic boom is a period of generally-rapid economic activity fueled by monetary inflation. It does not necessarily involve sustainable economic progress. In fact, most of the apparent gains achieved during the boom tend to be relinquished during the subsequent bust.
Trading in financial instruments and/or cryptocurrencies involves high risks including the risk of losing some, or all, of your investment amount, and may not be suitable for all investors. Prices of cryptocurrencies are extremely volatile and may be affected by external factors such as financial, regulatory or political events. Trading on margin increases the financial risks.
Before deciding to trade in financial instrument or cryptocurrencies you should be fully informed of the risks and costs associated with trading the financial markets, carefully consider your investment objectives, level of experience, and risk appetite, and seek professional advice where needed.
Fusion Media would like to remind you that the data contained in this website is not necessarily real-time nor accurate. The data and prices on the website are not necessarily provided by any market or exchange, but may be provided by market makers, and so prices may not be accurate and may differ from the actual price at any given market, meaning prices are indicative and not appropriate for trading purposes. Fusion Media and any provider of the data contained in this website will not accept liability for any loss or damage as a result of your trading, or your reliance on the information contained within this website.
It is prohibited to use, store, reproduce, display, modify, transmit or distribute the data contained in this website without the explicit prior written permission of Fusion Media and/or the data provider. All intellectual property rights are reserved by the providers and/or the exchange providing the data contained in this website.
Fusion Media may be compensated by the advertisers that appear on the website, based on your interaction with the advertisements or advertisers.