Bitcoin Trendline Failure
Tim Knight | Sep 26, 2022 03:46AM ET
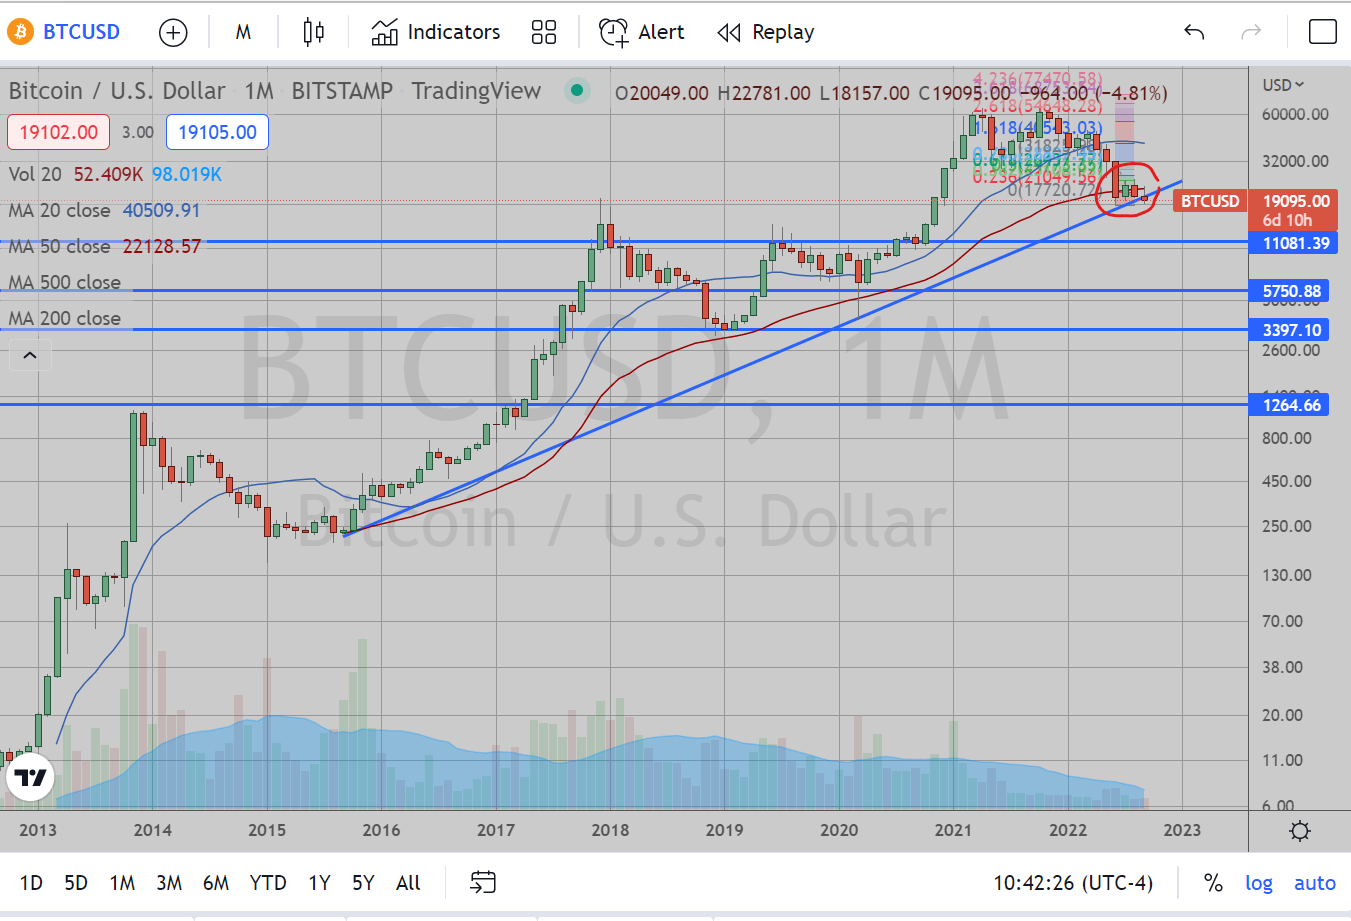
Let’s get the chart out the way. Bitcoin is starting to break beneath the trendline drawn from September 2015 lows through the March 2020 COVID lows. This trendline lines up right here at the horizontal area at 19666, the high set from December 2017. This is potentially a big break if the month successfully closes beneath the September open of 20,049. A successful break here would yield a very possible return to 11k, with subsequent support levels at 5750 and even 3400.
Bitcoin has been an interesting experiment since its inception. Thus far, it has generated a lot of conversation about the future of currency and contracts and thus, lots of hype as well. It is (was?) new, different and intriguing in its design and it has been touted as the future of everything, etc., etc. However, I have yet to see any real usage of it or how it may transform the world. Aside from the Bitcoin white paper itself, all that I could find in researching Bitcoin relates solely to the potential for riches that Bitcoin may provide. All articles or reports that I could find relate to Bitcoin’s “value” and how it is destined to be much higher, at $50,000 value, or $100,000, or $500,000, or even $1,000,000 per coin. Yet the reasoning in all these reports and articles bypasses the most fundamental question on a potential purchaser’s mind: “Why should I buy Bitcoin?”.
The only answers I could find always relate back to different versions of the same answer: “Because the value will go higher.” I suppose something similar could be said of precious metals to an extent. Sure, this is the reason why speculators may buy these, but why should I as a person purchase a Bitcoin? That is the key difference between Bitcoin and other commodities is that other commodities have a base function which cannot be replaced. Gold literally has molecular properties which cannot be replicated (i.e., only gold is gold, only platinum is platinum, etc.). Thus, these substances have a uniqueness which make them valuable in the most basic form of markets.
Bitcoin, on the other hand, does not (easily) display the same traits. Bitcoin’s main claim to value is that it is the original cryptocurrency, thus has the longest blockchain. In the realm of cryptocurrency, this does have value as the longest blockchain would theoretically be the safest (i.e., the hardest to hack). However, it is still easily replicated. Blockchains have been created since 2010 en masse to try to replicate the popularity of Bitcoin, and some have succeeded incredibly.
Some have even improved upon it, or so I have been told (Ethereum I suppose?). So this kind of blows a hole in the “uniqueness” of Bitcoin providing value. In other words, I am still not convinced of the necessity for my buying a Bitcoin other than to get the seller a bit richer and hope that the next buyer will make me richer. As such, since I have no reason to buy any cryptocurrency, they are all equally worthless to me. Considered a different way, try asking a farmer which is more valuable, a rocket ship which can reach Mars or one that can reach Saturn. His answer will likely be the same in that both are equally worthless.
Ok. That was a bit of a rant. So what’s the point? My point is that, throughout the hype which cryptocurrency has built upon itself for the past 12 years, a lot of the money which has rocketed its value up to nearly $70,000 in November 2021 was really tied to the free-flowing cash that has been around during the same time. People have been speculating all these years on this new form of currency which has yielded similar results in popularity as the Segway of 2001. And now that the free money has been turned off, speculators are no longer purchasing crypto coins.
I’ll end with this. I am not here to smear cryptocurrency (though it may be too late for that). I do think there is a place for cryptocurrency in our future. I do think value may exist there. But the true value is not going to be found in the current marketplace of a thousand different cryptocurrencies among which the general public cannot discern the difference and it will not be at the prices we see today.
Trading in financial instruments and/or cryptocurrencies involves high risks including the risk of losing some, or all, of your investment amount, and may not be suitable for all investors. Prices of cryptocurrencies are extremely volatile and may be affected by external factors such as financial, regulatory or political events. Trading on margin increases the financial risks.
Before deciding to trade in financial instrument or cryptocurrencies you should be fully informed of the risks and costs associated with trading the financial markets, carefully consider your investment objectives, level of experience, and risk appetite, and seek professional advice where needed.
Fusion Media would like to remind you that the data contained in this website is not necessarily real-time nor accurate. The data and prices on the website are not necessarily provided by any market or exchange, but may be provided by market makers, and so prices may not be accurate and may differ from the actual price at any given market, meaning prices are indicative and not appropriate for trading purposes. Fusion Media and any provider of the data contained in this website will not accept liability for any loss or damage as a result of your trading, or your reliance on the information contained within this website.
It is prohibited to use, store, reproduce, display, modify, transmit or distribute the data contained in this website without the explicit prior written permission of Fusion Media and/or the data provider. All intellectual property rights are reserved by the providers and/or the exchange providing the data contained in this website.
Fusion Media may be compensated by the advertisers that appear on the website, based on your interaction with the advertisements or advertisers.