Bitcoin Trades Within A Triangle
JFD Team | Oct 08, 2020 07:16AM ET
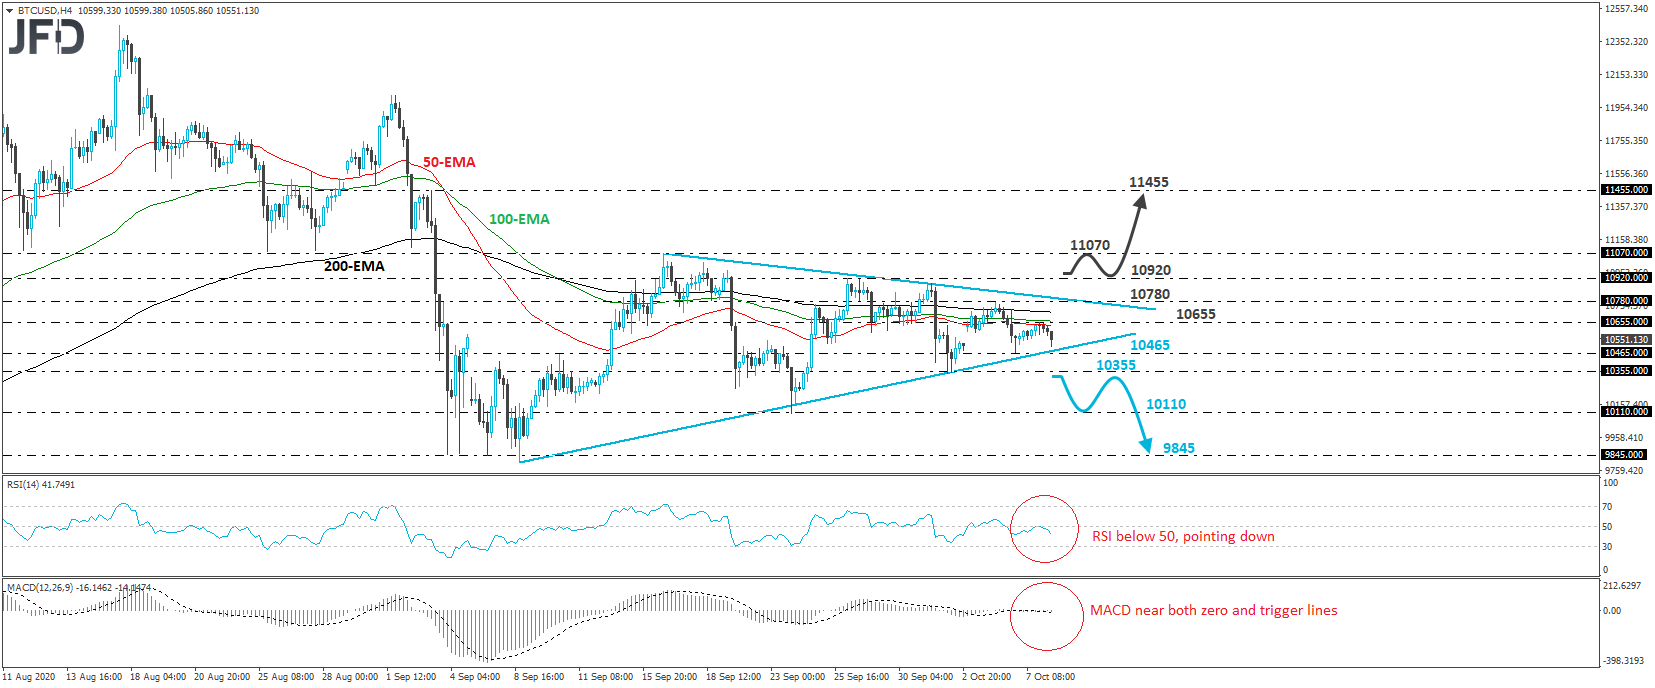
BTC/USD traded lower on Thursday, after it hit resistance at 10655 on Wednesday. Overall, the crypto has been trading within a symmetrical triangle formation since September 8th, and thus, despite the price’s proximity to the lower end of the triangle, we will hold a flat stance for now.
We will start examining the bearish case only if we see a clear dip below 10355. Such a move could also confirm the break below the lower end of the triangle and may initially pave the way towards the low of October 2nd, at around 10110. If that barrier is not able to halt the slide, a move lower may see scope for extensions towards the 9845 zone, which provided strong support on September 4th, 7th and 8th.
Turning our gaze to our short-term oscillators, we see that the MACD is flat, running very close to both its zero and trigger lines, something that enhances our choice to stay sidelined until the crypto exits the triangle. That said, the RSI lies below 50 and points down, indicating that there are more chances for a downside exit rather than an upside one.
In order to start considering the upside scenario, we would like to see a strong break above the 10920 resistance zone, marked by the high of September 28th. The next stop could be the peak of September 16th, at 11070, the break of which could carry larger bullish implications, perhaps paving the way towards the high of September 3rd, at 11455.
![]()
Trading in financial instruments and/or cryptocurrencies involves high risks including the risk of losing some, or all, of your investment amount, and may not be suitable for all investors. Prices of cryptocurrencies are extremely volatile and may be affected by external factors such as financial, regulatory or political events. Trading on margin increases the financial risks.
Before deciding to trade in financial instrument or cryptocurrencies you should be fully informed of the risks and costs associated with trading the financial markets, carefully consider your investment objectives, level of experience, and risk appetite, and seek professional advice where needed.
Fusion Media would like to remind you that the data contained in this website is not necessarily real-time nor accurate. The data and prices on the website are not necessarily provided by any market or exchange, but may be provided by market makers, and so prices may not be accurate and may differ from the actual price at any given market, meaning prices are indicative and not appropriate for trading purposes. Fusion Media and any provider of the data contained in this website will not accept liability for any loss or damage as a result of your trading, or your reliance on the information contained within this website.
It is prohibited to use, store, reproduce, display, modify, transmit or distribute the data contained in this website without the explicit prior written permission of Fusion Media and/or the data provider. All intellectual property rights are reserved by the providers and/or the exchange providing the data contained in this website.
Fusion Media may be compensated by the advertisers that appear on the website, based on your interaction with the advertisements or advertisers.