Bitcoin: The Parachute Seems Broken
Alpari Research & Analysis | Dec 10, 2018 08:13AM ET
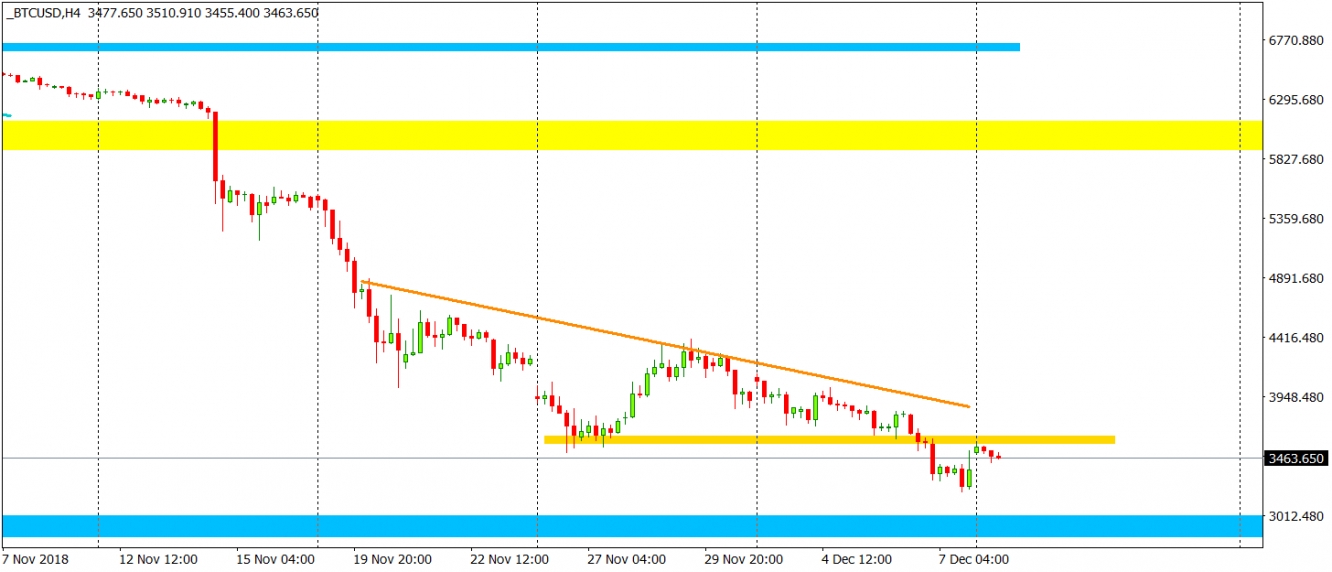
Time to deal again with the Bitcoin. Previously I mentioned this instrument on the 19th of November , when the price was slightly above the 5200 USD. We had a fresh sell signal after the breakout of the 6000 USD support. Our analysis was spot on, the price fell like a rock!. It has been almost a month, did anything change in this matter?
I think that current low prices created the situation, where random people already lost the interest in this instrument but fans of the technology and professional traders are starting to look for a buying opportunity. In my opinion, we are not there yet and we should experience a further decline here. The most recent development, after the support on the 6000 surrendered was the descending triangle pattern (orange). In a downtrend, this kind of a formation is a very strong bearish factor. No surprise then that the BTC broke the lower line of this pattern and went down.
The new weeks starts with the test of the broken support as a closest resistance, so a very clean price action movement. The test is so far positive for the sellers, which increases the chances for a further slide towards the 2900 USD (blue). That is our mid-term target for this instrument. In my opinion, chances that we will get there are very high.

Trading in financial instruments and/or cryptocurrencies involves high risks including the risk of losing some, or all, of your investment amount, and may not be suitable for all investors. Prices of cryptocurrencies are extremely volatile and may be affected by external factors such as financial, regulatory or political events. Trading on margin increases the financial risks.
Before deciding to trade in financial instrument or cryptocurrencies you should be fully informed of the risks and costs associated with trading the financial markets, carefully consider your investment objectives, level of experience, and risk appetite, and seek professional advice where needed.
Fusion Media would like to remind you that the data contained in this website is not necessarily real-time nor accurate. The data and prices on the website are not necessarily provided by any market or exchange, but may be provided by market makers, and so prices may not be accurate and may differ from the actual price at any given market, meaning prices are indicative and not appropriate for trading purposes. Fusion Media and any provider of the data contained in this website will not accept liability for any loss or damage as a result of your trading, or your reliance on the information contained within this website.
It is prohibited to use, store, reproduce, display, modify, transmit or distribute the data contained in this website without the explicit prior written permission of Fusion Media and/or the data provider. All intellectual property rights are reserved by the providers and/or the exchange providing the data contained in this website.
Fusion Media may be compensated by the advertisers that appear on the website, based on your interaction with the advertisements or advertisers.