Bitcoin Technicals Echo April’s Breakout—But Can Bulls Repeat the Move?
MarketPulse | May 16, 2025 02:32PM ET
Bitcoin prices have entered another period of consolidation since Saturday May 10 but bulls have been able to keep the price above the key psychological 100000 mark. Is the rally running out of steam or is more upside possible?
Firstly we saw a similar period of consolidation around the 95000 handle before price exploded around $10,000 in a three-day span. This move higher followed about 11 days of consolidation. Markets usually see a more aggressive breakout the longer an asset consolidates, the question is will bulls or bears prevail?
There are always conflicting views and at times signs which support both a bullish and bearish scenario. Let us take a look at what some of those factors might be moving forward.
According to Glassnode, since hitting a low of $75k on April 9, Bitcoin has been on a strong upward trend, driven by spot market activity. Along the way, there have been periods of sideways trading, where prices stabilize before moving higher.
This "stair-step" pattern is visible in the Cost Basis Distribution (CBD) heatmap, which shows clusters of Bitcoin being bought at similar price levels over the past three months.
These accumulation phases happened before each upward move, leading to the most recent surge to $104k.
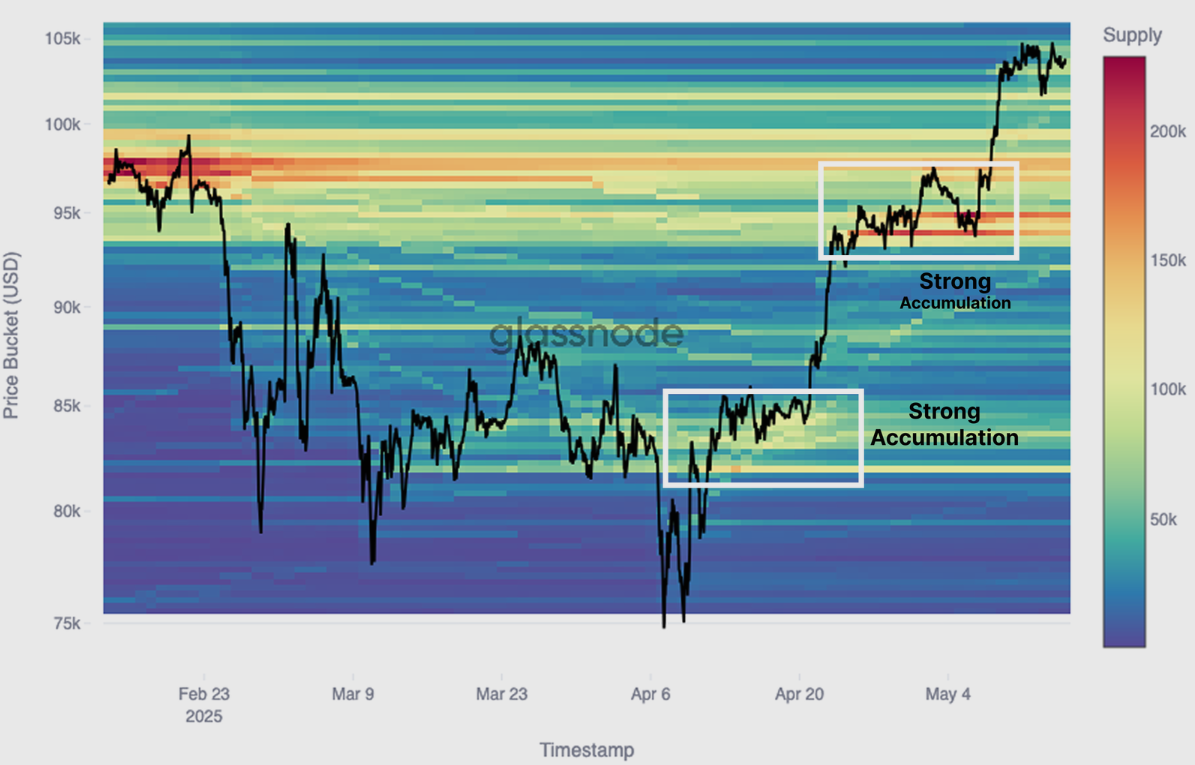
Over the past 30 days, a key accumulation zone has formed between $93k and $95k. This range matches the cost basis of short-term holders—investors who joined the market in the last 155 days.
Because of this, this zone is expected to serve as strong support if the market experiences a short-term dip, as it’s a price range where investors are likely to find value and buy again.
Approaching The Highs
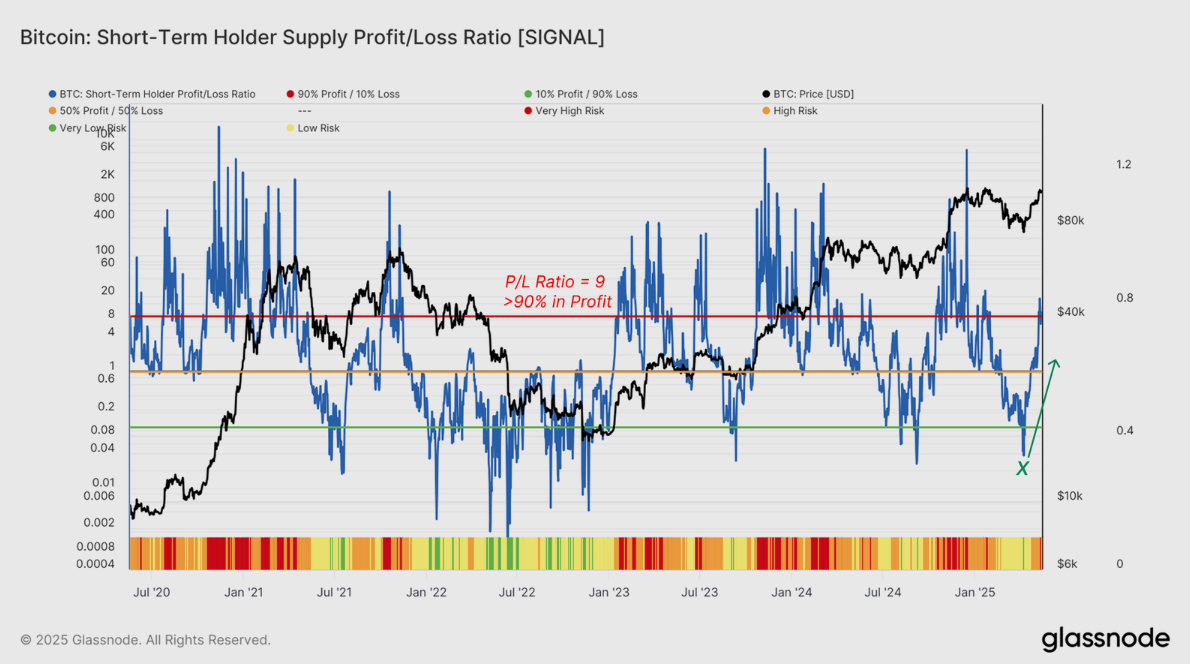
Bitcoin is now trading just below its all-time high of $109k, and excitement is building in the market. A great way to track this shift in sentiment is through the Short-Term Holder (STH) Supply in Profit/Loss Ratio, which shows how active investors are feeling.
This metric was especially useful during the April 7 correction, when it dropped to 0.03, meaning almost all short-term holders were at a loss. This happened as Bitcoin hit its $76k low. Since then, the ratio has jumped above 9.0, showing that over 90% of short-term holders are now in profit.
High values like this often signal riskier market conditions, as investors may start taking profits. While this can last for a while, it often leads to profit-taking or a local price peak if new demand slows down.
As long as the ratio stays well above 1.0, the bullish trend is likely to continue. But if it falls below 1.0 for an extended period, it could indicate weakening market strength and a potential trend reversal.
Key Takeaways from Glassnodes Data
Bitcoin’s climb back toward its all-time highs has been driven mainly by spot market activity, supported by strong buying on-chain and steady inflows off-chain. Most of the demand is coming from spot ETFs and major exchanges like Coinbase (NASDAQ:COIN). A key support zone has formed around $95k, and with less selling pressure, the uptrend looks solid.
Meanwhile, the derivatives markets are lagging behind. Open interest and funding rates haven’t fully caught up with the spot market’s momentum. In the options market, traders seem cautiously optimistic, and there’s little sign of excessive long positions in the futures market right now.
Looking at crypto markets as a whole, there has been an interesting technical breakout on XRP.
Ripple (XRP) Breakout? Can Bulls Push Price to Previous Highs?
Looking at Ripple whose popularity continues to grow and there are two key macroeconomic factors supporting its rise. Potential ETF approvals and the new US administration's approach to Crypto which has further eased any SEC issues.
On Polymarket, traders now believe there’s a 79% chance that spot ETFs for XRP will get approved. Meanwhile, Ripple has faced setbacks from SEC disputes in recent years. However, with the SEC case now settled, Ripple is free to move forward with its plans, which could include a potential IPO.
Looking at XRP/USD from a technical standpoint, we had a triangle pattern in play which has been broken.
We have now seen a retest of the trendline following two successive days of bearish price action.
A triangle pattern break could lead to a significant upside move. For now though price needs to hold above the swing low at 2.30 for the bullish momentum to remain in play.
Ripple (XRP/USD) Daily Chart, May 16, 2025
Technical Analysis - BTC/USD
Bitcoin (BTC/USD) from a technical standpoint has entered a period of consolidation similar to the one we witnessed around the 93000-95000 range a few weeks ago.
In that case a bullish breakout followed pushing price beyond the 100000 mark. The move obviously coincided with improved market sentiment across the board.
The question is whether another bullish breakout can occur in the absence of a significant catalyst?
The RSI period-14 remains in overbought territory and may serve as a caution warning for bulls.
Immediate resistance may come into play around the 106000 handle before the all-time highs around 109356 comes into play.
Immediate support rests at 103647 before the 100000 mark comes into focus.
Bitcoin (BTC/USD) Daily Chart, May 16, 2025
Trading in financial instruments and/or cryptocurrencies involves high risks including the risk of losing some, or all, of your investment amount, and may not be suitable for all investors. Prices of cryptocurrencies are extremely volatile and may be affected by external factors such as financial, regulatory or political events. Trading on margin increases the financial risks.
Before deciding to trade in financial instrument or cryptocurrencies you should be fully informed of the risks and costs associated with trading the financial markets, carefully consider your investment objectives, level of experience, and risk appetite, and seek professional advice where needed.
Fusion Media would like to remind you that the data contained in this website is not necessarily real-time nor accurate. The data and prices on the website are not necessarily provided by any market or exchange, but may be provided by market makers, and so prices may not be accurate and may differ from the actual price at any given market, meaning prices are indicative and not appropriate for trading purposes. Fusion Media and any provider of the data contained in this website will not accept liability for any loss or damage as a result of your trading, or your reliance on the information contained within this website.
It is prohibited to use, store, reproduce, display, modify, transmit or distribute the data contained in this website without the explicit prior written permission of Fusion Media and/or the data provider. All intellectual property rights are reserved by the providers and/or the exchange providing the data contained in this website.
Fusion Media may be compensated by the advertisers that appear on the website, based on your interaction with the advertisements or advertisers.