Bitcoin: Down Over 25% from its all-time high. Is It A Buy?
Dr. Arnout ter Schure | Jan 21, 2021 02:49PM ET
In my last article from 10 days ago, Bitcoin was trading at about the same levels as now: down 25% from its recent all-time-high. Using the Elliott Wave Principle (EWP) and Technical Analyses (TA) combined, I found:
“I prefer to see the current decline as a (red) intermediate wave-iv, which should ideally bottom around the 38.2% retrace of the entire (red) intermediate wave-iii rally that started since the September 2020 low: $29,680.”
“I view this wave-iv as a multi-week event, and I, therefore, expect at least a bounce back soon to around $36,130-39,210 before the next leg lower starts. That would complete a simple a-b-c lower, but 4th waves are known to be notoriously tricky and could morph into something more complex, such as a flat or a triangle (see ). We’ll have to deal with that as it unfolds.”
And:
“For now, the short-term downside risk seems to be small as several indicators are already close to oversold.”
What did we get?
BTC bottomed that same day, rallied to $40,093 over the next three days (I was off by 2.3% only) in an overlapping, three-waves fashion: b-wave. And since that high, it started a second decline: A more extensive “simple a-b-c lower” is now unfolding as anticipated. Thus, that’s three-out-of-three correct: the power of EWP and TA combined. It’s not fool-proof, no method is, but it is one the most reliable ways to assess and forecast financial markets.
Figure 1. Daily Bitcoin candlestick chart, with detailed EWP count and technical indicators:
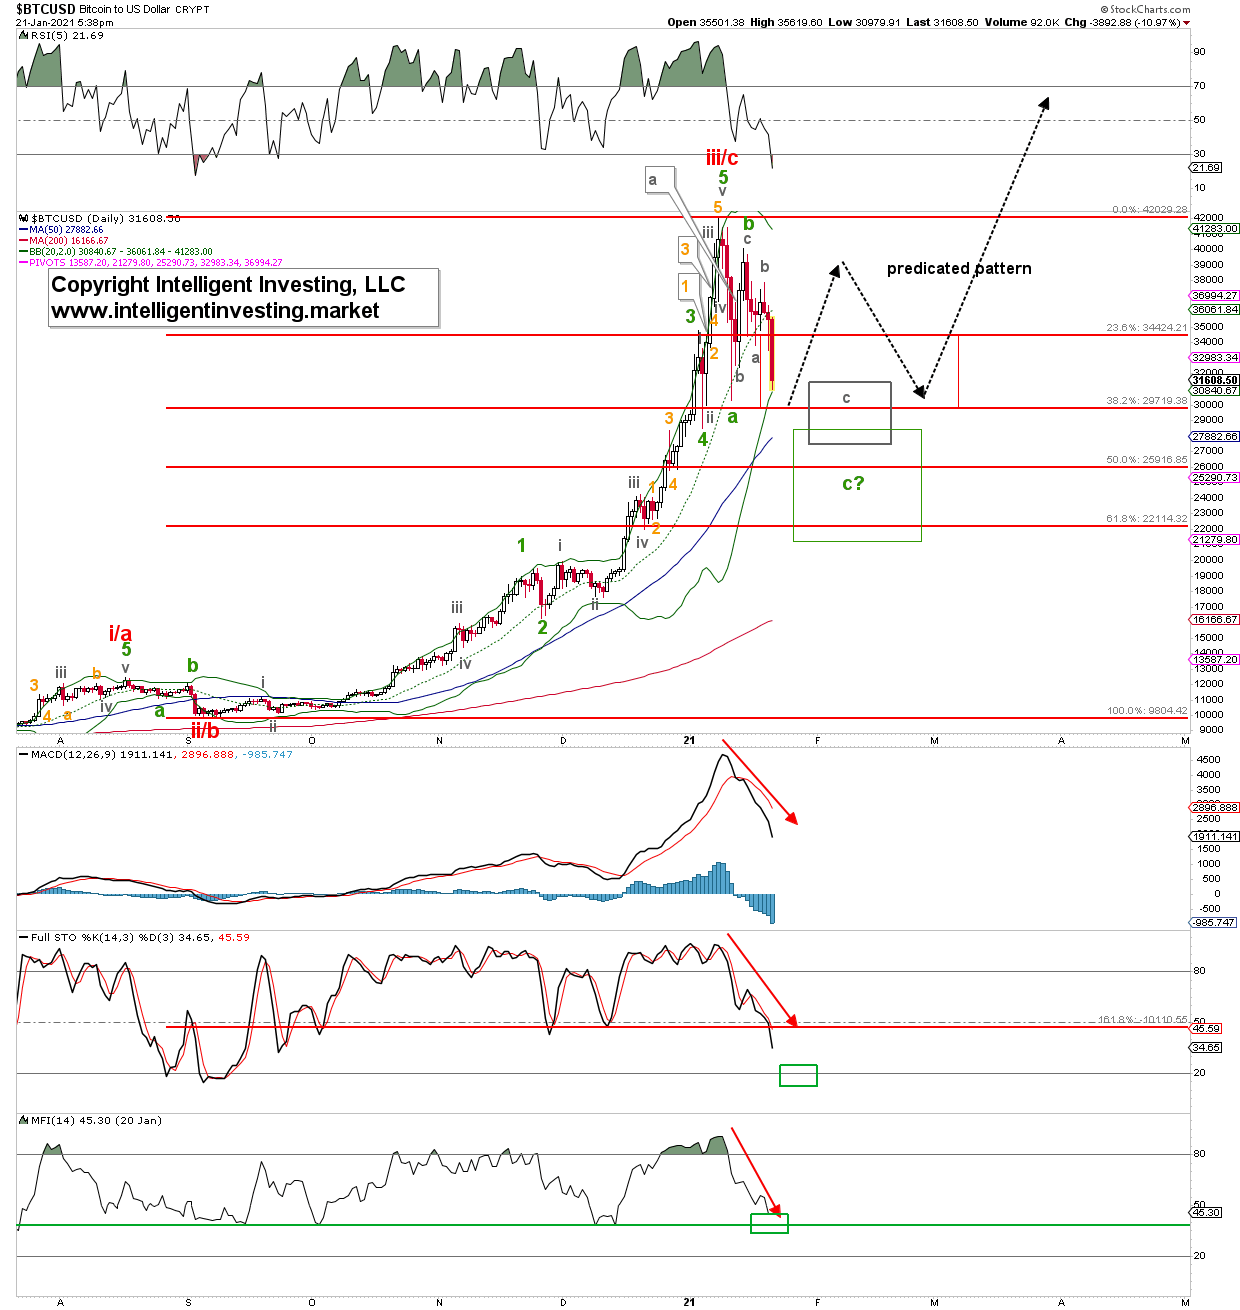
That said, the black arrows show the project path I had laid out for my Premium Cryptocurrencies Members , and so far, this is panning out as anticipated. I still expect BTC to bottom out soon in the red, grey- or even possibly the green target zones. The overlap of the red- and green target zones at around $29,700 is the preferred target zone and still in line with my previous article, where I “view the $29K+/-1K as a more likely support zone for the wave-iv.” And remember, in bull markets, we often have “upside surprises and downside disappointments.” A break and close below $28,400 is the first warning of worse things to come as then next support is not until $22-23,000.
The technical indicators on the daily time-frame are now close to oversold and have not been as oversold since the September 2020 lows. That low was at the intermediate-wave-degree. Thus, the current readings match the preferred view that the recent decline is of the same degree: an intermediate wave-iv and should be close to bottoming. Once complete, I expect a sharp rally (several weeks) to ATHs (think $50-60,000).
Bottom line: BTC has so far followed a classic, standard, three-wave corrective pattern to the ideal $29+/-1K target zone for an intermediate wave-iv. It should bottom soon (next few days) and then rally to new ATHs between, ideally $55-60,000, in the subsequent weeks. The bulls will be in trouble on a weekly close below $28,400 as that can target the next lower support zone at $23-22,000.
Trading in financial instruments and/or cryptocurrencies involves high risks including the risk of losing some, or all, of your investment amount, and may not be suitable for all investors. Prices of cryptocurrencies are extremely volatile and may be affected by external factors such as financial, regulatory or political events. Trading on margin increases the financial risks.
Before deciding to trade in financial instrument or cryptocurrencies you should be fully informed of the risks and costs associated with trading the financial markets, carefully consider your investment objectives, level of experience, and risk appetite, and seek professional advice where needed.
Fusion Media would like to remind you that the data contained in this website is not necessarily real-time nor accurate. The data and prices on the website are not necessarily provided by any market or exchange, but may be provided by market makers, and so prices may not be accurate and may differ from the actual price at any given market, meaning prices are indicative and not appropriate for trading purposes. Fusion Media and any provider of the data contained in this website will not accept liability for any loss or damage as a result of your trading, or your reliance on the information contained within this website.
It is prohibited to use, store, reproduce, display, modify, transmit or distribute the data contained in this website without the explicit prior written permission of Fusion Media and/or the data provider. All intellectual property rights are reserved by the providers and/or the exchange providing the data contained in this website.
Fusion Media may be compensated by the advertisers that appear on the website, based on your interaction with the advertisements or advertisers.