Bitcoin: Do Volatile, Bullish Sessions Lead To Further Gains?

 | Jun 27, 2019 06:20AM ET

Bitcoin has been grabbing the limelight once more as it breaks through key levels like a knife through butter. Having travelled 20% yesterday alone, we've analysed how the crypto currency has performed on previous occasions following such levels of volatility.

Get The News You Want
Read market moving news with a personalized feed of stocks you care about.
Get The App

Get The News You Want
Read market moving news with a personalized feed of stocks you care about.
Get The App

Get The News You Want
Read market moving news with a personalized feed of stocks you care about.
Get The App

BTC Daily Chart

Get The News You Want
Read market moving news with a personalized feed of stocks you care about.
Get The App

Get The News You Want
Read market moving news with a personalized feed of stocks you care about.
Get The App

Get The News You Want
Read market moving news with a personalized feed of stocks you care about.
Get The App

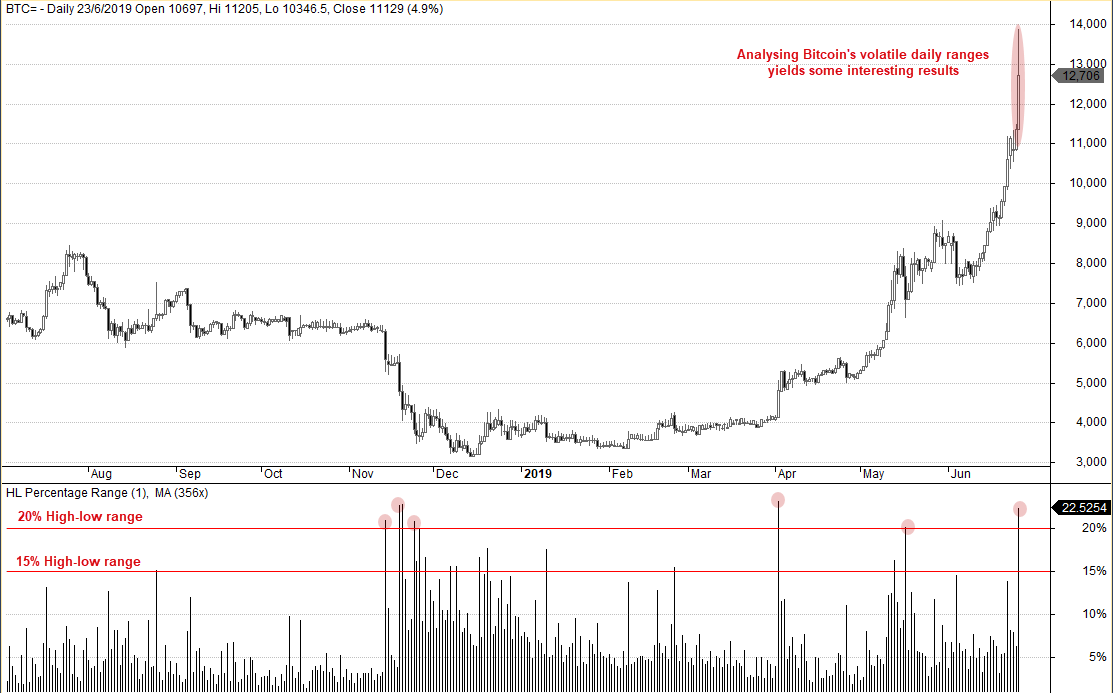
It’s no secret the Bitcoin (BTC) and other crypto currencies are highly volatile vehicles, which can post eye watering numbers when compared with other instruments. For example, BTC has rallied over 80% since the June low just three ago, and even this pales in comparison to 326% appreciation since December’s low to yesterday’s high. Just yesterday, Bitcoin’s daily range exceeded 20%, a threshold which could be the difference between a bull or a bear market to other assets. With that in mind, we’ll take a closer look at how Bitcoin has behaved under such volatile conditions.

Get The News You Want
Read market moving news with a personalized feed of stocks you care about.
Get The App

Get The News You Want
Read market moving news with a personalized feed of stocks you care about.
Get The App

Using data going since July 2014:

Get The News You Want
Read market moving news with a personalized feed of stocks you care about.
Get The App

Get The News You Want
Read market moving news with a personalized feed of stocks you care about.
Get The App

  • There have been 38 sessions where Bitcoin’s daily range was >=20%.
  • Of these 38 days, 36.9% were bullish (63.2% were bearish)
  • From this sample, the largest bullish close was 22.4% (largest bearish day was -24.5%)

Get The News You Want
Read market moving news with a personalized feed of stocks you care about.
Get The App

From this we see that:

Get The News You Want
Read market moving news with a personalized feed of stocks you care about.
Get The App

Get The News You Want
Read market moving news with a personalized feed of stocks you care about.
Get The App

  • Nearly 2/3 of daily ranges >=20% were bearish
  • The most bullish day from the sample was larger than the most bearish
  • Such levels of single-day volatility have been favourable to the bear-camp.

Get The News You Want
Read market moving news with a personalized feed of stocks you care about.
Get The App

However, as the trend is undeniably bullish and yesterday closed nearly 12% higher, we’d like to drill down into the data to see Bitcoins forward returns following bullish days with a range >=20%. For clarity, forward returns measure the performance of a market following a particular event, using historical data.

Get The News You Want
Read market moving news with a personalized feed of stocks you care about.
Get The App

Get The News You Want
Read market moving news with a personalized feed of stocks you care about.
Get The App

Get The News You Want
Read market moving news with a personalized feed of stocks you care about.
Get The App

Get The News You Want
Read market moving news with a personalized feed of stocks you care about.
Get The App

Get The News You Want
Read market moving news with a personalized feed of stocks you care about.
Get The App

Get The News You Want
Read market moving news with a personalized feed of stocks you care about.
Get The App

Get The News You Want
Read market moving news with a personalized feed of stocks you care about.
Get The App

T+1: % return next day
T+1-2: % Returns over the next 2 days

Get The News You Want
Read market moving news with a personalized feed of stocks you care about.
Get The App

Get The News You Want
Read market moving news with a personalized feed of stocks you care about.
Get The App

Get The News You Want
Read market moving news with a personalized feed of stocks you care about.
Get The App

Get The News You Want
Read market moving news with a personalized feed of stocks you care about.
Get The App

Following bullish days with a high-low range >= 20%:

Get The News You Want
Read market moving news with a personalized feed of stocks you care about.
Get The App

Get The News You Want
Read market moving news with a personalized feed of stocks you care about.
Get The App

  • On average, the following day produced negative returns of -1.14%, and closed lower 61.5% of the time
  • After two days, bitcoin averaged -0.93% return and closed lower 61.5% of the time
  • On average, positive returns were seen with hold times between 3 and 10 days after the event
  • Typically, the average return increases over time towards a 10-day hold after the event
  • Average returns peaked after 10-days of holding
  • Media (typical returns) peak around 8 days later (just over a week)

Get The News You Want
Read market moving news with a personalized feed of stocks you care about.
Get The App

It’s worth noting at this stage that there have only been 13 days that fit our criteria. Statistically speaking, we’d want at least 30 occurrences at a minimum to be confident the results were valid. However, if we drop the threshold to 15% high-low range, the sample size becomes 33 and similar patterns emerge.

Get The News You Want
Read market moving news with a personalized feed of stocks you care about.
Get The App

Get The News You Want
Read market moving news with a personalized feed of stocks you care about.
Get The App

Get The News You Want
Read market moving news with a personalized feed of stocks you care about.
Get The App

Get The News You Want
Read market moving news with a personalized feed of stocks you care about.
Get The App

Get The News You Want
Read market moving news with a personalized feed of stocks you care about.
Get The App

Get The News You Want
Read market moving news with a personalized feed of stocks you care about.
Get The App

Get The News You Want
Read market moving news with a personalized feed of stocks you care about.
Get The App

Get The News You Want
Read market moving news with a personalized feed of stocks you care about.
Get The App

Get The News You Want
Read market moving news with a personalized feed of stocks you care about.
Get The App

Following bullish days with a high-low range >= 15%:

Get The News You Want
Read market moving news with a personalized feed of stocks you care about.
Get The App

Get The News You Want
Read market moving news with a personalized feed of stocks you care about.
Get The App

  • On average, all holding periods produced a positive return
  • 10-days holding period produced the highest, average return
  • Median (typical) average return peaks at 8 days

Get The News You Want
Read market moving news with a personalized feed of stocks you care about.
Get The App

And, to drill down a little further, we look at average returns on a day by day basis.

Get The News You Want
Read market moving news with a personalized feed of stocks you care about.
Get The App

Get The News You Want
Read market moving news with a personalized feed of stocks you care about.
Get The App

Get The News You Want
Read market moving news with a personalized feed of stocks you care about.
Get The App

Get The News You Want
Read market moving news with a personalized feed of stocks you care about.
Get The App

Get The News You Want
Read market moving news with a personalized feed of stocks you care about.
Get The App

Get The News You Want
Read market moving news with a personalized feed of stocks you care about.
Get The App

Get The News You Want
Read market moving news with a personalized feed of stocks you care about.
Get The App

Following bullish days with a high-low range >= 20%:

Get The News You Want
Read market moving news with a personalized feed of stocks you care about.
Get The App

Get The News You Want
Read market moving news with a personalized feed of stocks you care about.
Get The App

  • The highest % return occurred on day 6 (T+6)
  • The 2nd highest % return occurred on day 3 (T+3)
  • The 3rd day closed higher 84.6% of the time
  • The 6th day closed higher 69.2% of the time

Get The News You Want
Read market moving news with a personalized feed of stocks you care about.
Get The App

So from this data-set, day 3 and 6 after the event were the most profitable. And if we re-run the test using a >=15% threshold (to increase the sample to 33) then the results are similar, only the returns are smaller.

Get The News You Want
Read market moving news with a personalized feed of stocks you care about.
Get The App

Get The News You Want
Read market moving news with a personalized feed of stocks you care about.
Get The App

Key Takeaway:

Get The News You Want
Read market moving news with a personalized feed of stocks you care about.
Get The App

Overall, it suggests that on average, bullish sessions with a range >=15% or >=20% lead to a positive return on day 3 or 6. Furthermore, holding between days 3 to 10 yields an increasing positive return.

Get The News You Want
Read market moving news with a personalized feed of stocks you care about.
Get The App

Get The News You Want
Read market moving news with a personalized feed of stocks you care about.
Get The App

Of course, past results are not indicative of the future – but there are some interesting numbers here none the less.

Get The News You Want
Read market moving news with a personalized feed of stocks you care about.
Get The App

Original Post

Get The News You Want
Read market moving news with a personalized feed of stocks you care about.
Get The App

Get The News You Want
Read market moving news with a personalized feed of stocks you care about.
Get The App

Trading in financial instruments and/or cryptocurrencies involves high risks including the risk of losing some, or all, of your investment amount, and may not be suitable for all investors. Prices of cryptocurrencies are extremely volatile and may be affected by external factors such as financial, regulatory or political events. Trading on margin increases the financial risks.
Before deciding to trade in financial instrument or cryptocurrencies you should be fully informed of the risks and costs associated with trading the financial markets, carefully consider your investment objectives, level of experience, and risk appetite, and seek professional advice where needed.
Fusion Media would like to remind you that the data contained in this website is not necessarily real-time nor accurate. The data and prices on the website are not necessarily provided by any market or exchange, but may be provided by market makers, and so prices may not be accurate and may differ from the actual price at any given market, meaning prices are indicative and not appropriate for trading purposes. Fusion Media and any provider of the data contained in this website will not accept liability for any loss or damage as a result of your trading, or your reliance on the information contained within this website.
It is prohibited to use, store, reproduce, display, modify, transmit or distribute the data contained in this website without the explicit prior written permission of Fusion Media and/or the data provider. All intellectual property rights are reserved by the providers and/or the exchange providing the data contained in this website.
Fusion Media may be compensated by the advertisers that appear on the website, based on your interaction with the advertisements or advertisers.

Sign out
Are you sure you want to sign out?
NoYes
CancelYes
Saving Changes