Bitcoin Crashes To $9,000, Indicators Point To A Rebound
Crypto Briefing | Jun 03, 2020 12:39AM ET
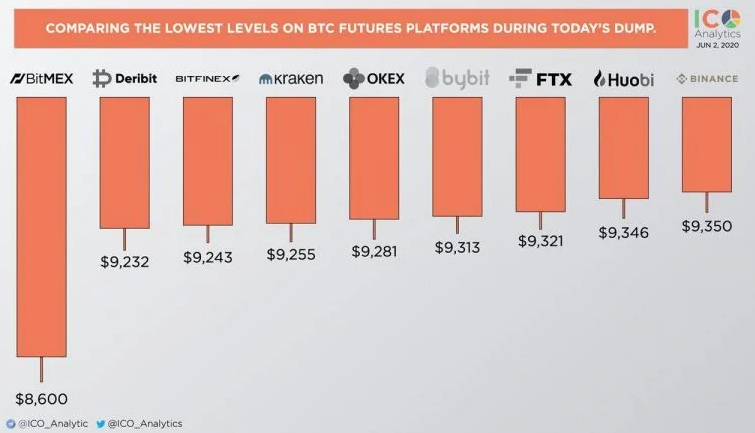
Over $102 million in long positions were liquidated on BitMEX, pushing Bitcoin into another period of turbulence.
Key Takeaways
- Bitcoin took a $1,000 nosedive that erased this week's gains in a matter of minutes.
- Despite the massive bearish impulse, there is a major support level that could prevent further losses.
- If this barrier continues to hold, BTC may enter a consolidation phase before its price is forced to breakout.
Bitcoin failed to turn the $10,000 resistance level into support, which caused a $1,000 drop in the last few hours. But bullish price action isn’t out of the question just yet.
Bitcoin Crashes Within Minutes
Bitcoin’s price is going wild. The flagship cryptocurrency was able to rise by more than 10% yesterday and move past the $10,000 threshold. However, BTC recently took a brutal $1,000 nosedive that erased these gains in a matter of five minutes.
Yesterday, Crypto Briefing warned readers that investors were growing overwhelmingly bullish about the recent price action. Sentiment sent the Crypto Fear and Greed Index into “greed,” which is a negative sign. But few predicted that the market would respond with a massive bearish impulse.
liquidated , pushing BTC to $8,600.
Despite the sudden downward movement, different technical indexes show that everything is not lost yet.
There’s Still Hope for Recovery
The lower boundary of an ascending parallel channel, which has contained Bitcoin since March’s Black Thursday , seems to have prevented a steeper decline.
If this barrier continues to hold, the price history of the past three months may repeat itself. The flagship cryptocurrency could then bounce off this support level back to the middle or towards the upper boundary of the channel at $12,500.
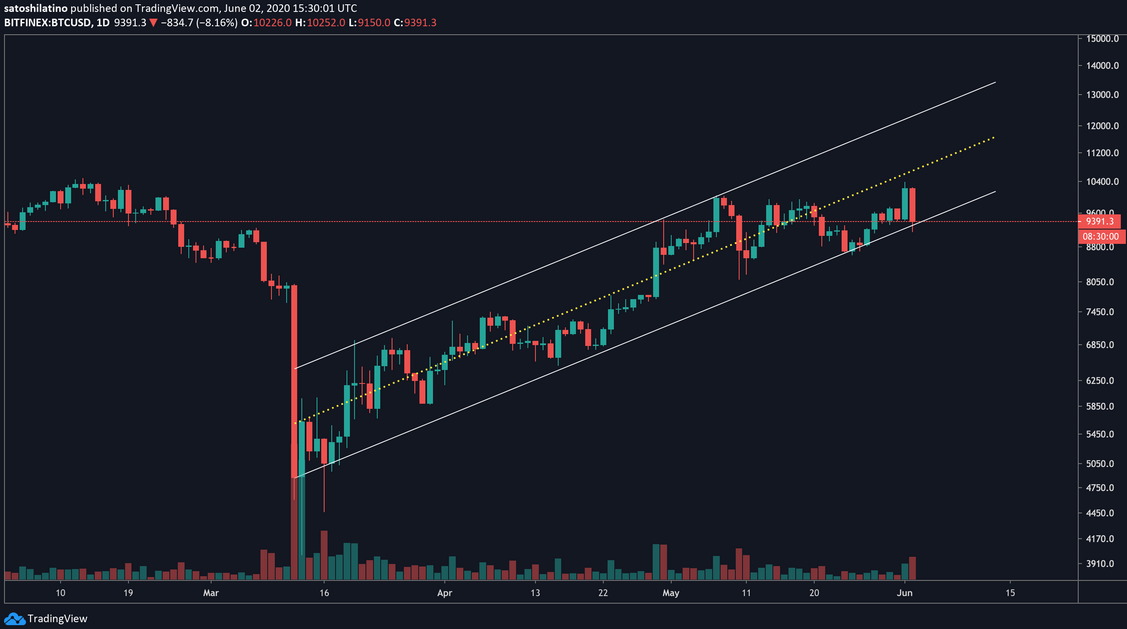
The Fibonacci retracement indicator adds credence to this outlook. Based on this technical index, Bitcoin may consolidate between $9,100 and $10,500 for an extended time before it provides a clear sign of where it is headed next.
Breaking below the support provided by the 78.6% Fibonacci retracement level could jeopardize the bullish view and trigger a steeper decline. Under such circumstances, the next critical support areas to pay attention to are 61.8% and 50% Fibonacci retracement levels. These support barriers sit at $8,000 and $7,300, respectively.
On the flip side, an increase in the buying pressure behind BTC that allows it to move past the $10,500 resistance could propel it towards new yearly highs.
It is worth mentioning that on BTC’s 1-week chart, the TD sequential indicator is currently presenting a sell signal in the form of a green nine candlestick. If it were to be validated, one could expect a one to four candlestick correction on the weekly chart before the continuation of the uptrend.
With all of these factors in mind, it is crucial to understand the support and resistance levels mentioned above to capture profits from the next major price movement.
Trading in financial instruments and/or cryptocurrencies involves high risks including the risk of losing some, or all, of your investment amount, and may not be suitable for all investors. Prices of cryptocurrencies are extremely volatile and may be affected by external factors such as financial, regulatory or political events. Trading on margin increases the financial risks.
Before deciding to trade in financial instrument or cryptocurrencies you should be fully informed of the risks and costs associated with trading the financial markets, carefully consider your investment objectives, level of experience, and risk appetite, and seek professional advice where needed.
Fusion Media would like to remind you that the data contained in this website is not necessarily real-time nor accurate. The data and prices on the website are not necessarily provided by any market or exchange, but may be provided by market makers, and so prices may not be accurate and may differ from the actual price at any given market, meaning prices are indicative and not appropriate for trading purposes. Fusion Media and any provider of the data contained in this website will not accept liability for any loss or damage as a result of your trading, or your reliance on the information contained within this website.
It is prohibited to use, store, reproduce, display, modify, transmit or distribute the data contained in this website without the explicit prior written permission of Fusion Media and/or the data provider. All intellectual property rights are reserved by the providers and/or the exchange providing the data contained in this website.
Fusion Media may be compensated by the advertisers that appear on the website, based on your interaction with the advertisements or advertisers.