Big U.S. Stocks’ Q3’18 Fundamentals
Adam Hamilton | Nov 11, 2018 02:39AM ET
The widely-held mega-cap stocks that dominate the US markets are just wrapping up another blockbuster earnings season. Sales and profits soared largely due to Republicans’ massive corporate tax cuts. Still these lofty stock markets are vulnerable to serious downside, as October’s brutal plunge proved. Such extreme revenue and earnings growth cannot persist, and valuations remain in dangerous bubble territory.
Four times a year publicly-traded companies release treasure troves of valuable information in the form of quarterly reports. Required by the US Securities and Exchange Commission, these 10-Qs contain the best fundamental data available to investors and speculators. They dispel all the sentimental distortions inevitably surrounding prevailing stock-price levels, revealing the underlying hard fundamental realities.
The deadline for filing 10-Qs for “large accelerated filers” is 40 days after fiscal quarter-ends. The SEC defines this as companies with market capitalizations over $700m. That currently includes every stock in the flagship S&P 500 stock index (SPX), which includes the biggest and best American companies. The middle of this week marked 38 days since the end of Q3, so almost all the big US stocks have reported.
The SPX is the world’s most-important stock index by far, with its components commanding a staggering collective market cap of $26.1t at the end of Q3! The vast majority of investors own the big US stocks of the SPX, as some combination of them are usually the top holdings of nearly every investment fund. That includes retirement capital, so the fortunes of the big US stocks are crucial for Americans’ overall wealth.
The major ETFs that track the S&P 500 dominate the increasingly-popular passive-investment strategies as well. The SPY SPDR S&P 500 ETF (NYSE:SPY), iShares Core S&P 500 (AX:IVV), and Vanguard S&P 500 (NYSE:VOO)are among the largest in the world. This week they reported colossal net assets of $265.5b, $164.9b, and $101.5b respectively! They were naturally even larger at the end of Q3 before October’s carnage.
Every quarter after earnings season it’s essential to review the big US stocks’ latest results to see how they’re faring fundamentally. Their quarterly reports offer the best and latest fundamental data, and considered as a whole provide many clues on likely near-future stock-market trends. And since the SPX hit new record highs in late Q3 before plunging in early Q4, these latest results may prove a critical inflection point.
While I’d love to analyze all 500 SPX stocks each quarter, my small financial-research company lacks the manpower. Support our business with enough newsletter subscriptions, and I’ll hire the people necessary to do it. For now I’m digging into the top 34 SPX/SPY components ranked by market cap. That’s simply an arbitrary number that fits neatly into the tables below, but it happens to be a dominant sample of the SPX.
At the end of Q3, these 34 elite American companies alone accounted for a colossal 43.4% of the total weight of the S&P 500! Their enormous total market cap of $11.3t equaled that of the bottom 436 SPX companies. So the big US stocks’ importance to the entire stock markets cannot be overstated. They are the mighty engine driving overall stock-market performance, dragging everything else along for the ride.
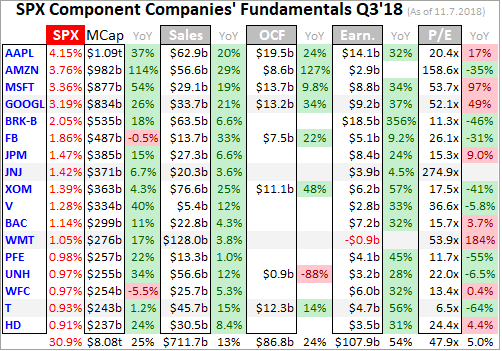
Every quarter I wade through the 10-Q SEC filings of these top SPX companies for a ton of fundamental data I dump into a spreadsheet for analysis. The highlights make it into these tables below. They start with each company’s symbol, weighting in the SPX and SPY, and market cap as of the final trading day of Q3’18. That’s followed by the year-over-year change in each company’s market capitalization, a key metric.
Major US corporations have been engaged in a wildly-unprecedented stock-buyback binge ever since the Fed forced interest rates to deep artificial lows during 2008’s stock panic. Thus the appreciation in their share prices also reflects shrinking shares outstanding. Looking at market-cap changes instead of just underlying share-price changes effectively normalizes out stock buybacks, offering purer views of value.
That’s followed by quarterly sales along with their YoY changes. Top-line revenues are one of the best indicators of businesses’ health. While profits can be easily manipulated quarter-to-quarter by playing with all kinds of accounting estimates, sales are tougher to artificially inflate. Ultimately sales growth is necessary for companies to expand, as bottom-line profits growth driven by cost-cutting is inherently limited.
Operating cash flows are also important, showing how much capital companies’ businesses are actually generating. Using cash to make more cash is a core tenet of capitalism. Unfortunately many companies are now obscuring quarterly OCFs by reporting them in year-to-date terms, which lumps in multiple quarters together. So these tables only include Q3 operating cash flows if specifically broken out by companies.
Next are the actual hard quarterly earnings that must be reported to the SEC under Generally Accepted Accounting Principles. Late in bull markets, companies tend to use fake pro-forma earnings to downplay real GAAP results. These are derided as EBS earnings, Everything but the Bad Stuff! Companies often arbitrarily ignore certain expenses on a pro-forma basis to artificially boost their profits, which is misleading.
While we’re also collecting the earnings-per-share data Wall Street loves, it’s more important to consider total profits. Stock buybacks are executed to manipulate EPS higher, because the shares-outstanding denominator of its calculation shrinks as shares are repurchased. Raw profits are a cleaner measure, again effectively neutralizing the impacts of stock buybacks. They better reflect underlying business performance.
Finally the trailing-twelve-month price-to-earnings ratios as of the end of Q3’18 are noted. TTM P/Es look at the last four reported quarters of actual GAAP profits compared to prevailing stock prices. They are the gold-standard metric for valuations. Wall Street often intentionally obscures these hard P/Es by using the fictional forward P/Es instead, which are literally mere guesses about future profits that often prove far too optimistic.
These are mostly calendar-Q3 results, but some big US stocks use fiscal quarters offset from the normal ones. Walmart (NYSE:WMT), Home Depot (NYSE:HD), Cisco (NASDAQ:CSCO), and NVIDIA (NASDAQ:NVDA) have quarters ending one month after calendar ones, so their results here are current to the end of July instead of September. Oracle (NYSE:ORCL) uses quarters that end one month before calendar ones, so its results are as of the end of August. Offset reporting ought to be banned.
Reporting on offset quarters renders companies’ results way less comparable with the vast majority that report on calendar quarters. We traders all naturally think in calendar-quarter terms too. As of the middle of this week, Disney hadn’t yet reported its Q3 results. That’s when its fiscal year ends, and the larger, more-complex, and audited 10-K annual reports required by the SEC aren’t due until 60 days after quarter ends.
Stocks with symbols highlighted in blue have newly climbed into the ranks of the SPX’s top 34 companies over the past year, as investors bid their stock prices and thus market caps higher. Overall the big US stocks’ Q3’18 results looked utterly magnificent, with both revenues and earnings soaring under this new slashed-corporate-taxes regime. But ominously many valuations remained at dangerous bubble levels.
From the end of Q3’17 to Q3’18, the S&P 500 rallied 15.7% higher. These are certainly strong gains impressive in their own right. But its elite top 34 component stocks really outperformed, pulling up the rest of the index. Their market caps blasted an incredible 24.2% higher YoY on average! Without their outsized gains, the SPX would’ve been heavily muted at best. Market breadth really continued to narrow.
Extreme narrowing breadth is a telltale sign of a very-late-stage bull market. And the main cause was the vast flood of capital into the market-darling mega tech stocks, which have long dominated the entire US stock markets. The FANG names are the most famous, Facebook (NASDAQ:FB), Amazon (NASDAQ:AMZN), Netflix (NASDAQ:NFLX), and Alphabet (NASDAQ:GOOGL) which used to called Google. Apple (NASDAQ:AAPL) and Microsoft (NASDAQ:MSFT) also belong in those rarified ranks of wildly-popular beloved techs.
As of the end of Q3, AAPL, AMZN, MSFT, GOOGL, and FB were 5 of the 6 largest US stocks in market-cap terms, topping the SPX’s ranks. They alone accounted for a mind-boggling 16.3% of the weighting of this entire index! Add in NFLX, and that swells to 17.0%. Just 6 stocks commanding over 1/6th of the S&P 500’s entire collective market cap is extreme by any measure. This is a grave risk to the whole markets.
By late September the SPX had powered 333.2% higher over 9.5 years, making for the 2nd-largest and 1st-longest stock bull in US history. The mega techs led the way. Way back in March 2009 when this monstrous bull was born, MSFT, GOOGL, AAPL, and AMZN clocked in at 5.4% of the SPX’s entire weighting. FB and NFLX hadn’t yet been added to the S&P 500 then. So mega techs’ relative footprint tripled.
Ever more capital was crowding into fewer and fewer stocks, with fund managers chasing the winners and increasingly piling into them. Ignoring their lofty stock prices relative to their underlying profits, the fundamentals seemed to support that buying frenzy. In Q3’18 these half-dozen mega techs reported unbelievable average sales growth of 26.0% YoY! That shouldn’t even be possible given their colossal sizes.
That trounced the good 8.3% annual revenue growth seen in the rest of the top 34, making the mega-tech love affair seem righteous. Overall these big US stocks saw average sales growth of 11.5% YoY, which was skewed higher by the mega techs. I’ve seen countless fund managers on CNBC arguing that these stocks’ extreme revenue growth justifies buying them at any price. But it isn’t sustainable at such a torrid pace.
The math itself is damning. At 25% annual growth, sales would double every 3 years or so. And these 6 beloved mega techs are already huge, with average Q3 revenues of $33.3b! They can’t keep doubling and doubling without gobbling up the entire US economy, which obviously can’t happen. I also suspect their crazy sales growth is a function of euphoric spending driven by record stock markets and corporate tax cuts.
This has fueled epic levels of optimism about the future, and thus abnormally-outsized levels of spending from both individuals and businesses in recent years. That’s greatly goosed sales across the entire stock markets. But once these stock markets inevitably roll over, euphoria will fade forcing spending to quickly mean revert lower. Much of this buying binge was financed by enormous new borrowing as well, a big problem.
With interest rates inexorably rising as the Fed keeps hiking, both consumers and corporations will lose their desire and ability to keep piling on new debt. That will weigh on spending, and slow it significantly if they start diverting some income to pay down their increasingly-expensive debt. That portends far-slower corporate-sales growth or even shrinkage ahead, killing the sentiment-driven anomaly of 25%+ in mega techs.
Unfortunately half of these big US stocks didn’t break out their Q3 operating cash flows, instead lumping them into year-to-date numbers. While Q3 can be backed out by subtracting their Q2 YTD numbers, I left the non-reported OCFs blank in these tables. But of the 17 of these elite companies reporting them in Q3, the average growth was 20.6% YoY. The 5 mega techs ex-Netflix did way better averaging +43.5%!
Earnings naturally amplify sales trends, leveraging any growth. So with big US stocks’ revenues surging on the unbridled optimism from record-high stock markets and big corporate tax cuts, profits should’ve soared in Q3. And they did, with breathtaking annual growth averaging 53.8% in these elite companies! That is again being widely used to justify buying mega tech stocks at any price, ignoring their valuations.
Interestingly the bifurcation between those half-dozen market-darling tech stocks and the rest of the SPX top 34 was much narrower than in sales. The mega techs’ earnings rocketed up 64.5% YoY on average, a stupendous gain. Yet the rest of the top 34 weren’t far behind averaging 51.7% YoY. That’s mere 1.2x outperformance by the mega techs, compared to 3.1x in sales growth. Why didn’t their earnings grow more?
But that 51.7% for the rest of the top 34 is skewed. Warren Buffett’s famous Berkshire Hathaway (NYSE:BRKa), which is the largest non-technology stock in the SPX, reported a gargantuan $18.5b profit in Q3 soaring 356% YoY! But nearly 4/5ths of that resulted from investment gains which aren’t normal earnings. Ex-BRK, the rest of the top 34 outside of those half-dozen mega techs had average profits growth of 39.0% YoY in Q3.
That raises the mega techs’ outperformance to 1.7x, which remains way short of their 3.1x sales growth. They only grew profits 64.5% on 26.0% sales growth, while the rest of the top 34 saw profits rise 51.7% on mere 8.3% revenue upside! That makes it look like the mega techs are getting less efficient. Perhaps hubris has set in with their sky-high stock prices and universal popularity, leading to excessive expenses.
But the serious downside risks to mega techs and thus the entire stock markets come from their bubble valuations. Over the past century and a quarter or so, fair value for the US stock markets has averaged about 14x earnings. That is reasonable and makes sense, as it implies a 7.1% long-term rate of return before dividends. Dangerous bubble territory begins at 28x, when stocks are twice as expensive as normal.
As Q3’18 ended just off all-time-record SPX highs, those 6 mega tech stocks averaged scary TTM P/Es of 80.2x! In other words, investors buying their stocks then would expect to wait fully 80 years before they earned back that price paid assuming no earnings growth. That’s ludicrously expensive, wildly unjustified fundamentally. Even after years of massive sales and profits growth, tech earnings remain way too small.
Trading in financial instruments and/or cryptocurrencies involves high risks including the risk of losing some, or all, of your investment amount, and may not be suitable for all investors. Prices of cryptocurrencies are extremely volatile and may be affected by external factors such as financial, regulatory or political events. Trading on margin increases the financial risks.
Before deciding to trade in financial instrument or cryptocurrencies you should be fully informed of the risks and costs associated with trading the financial markets, carefully consider your investment objectives, level of experience, and risk appetite, and seek professional advice where needed.
Fusion Media would like to remind you that the data contained in this website is not necessarily real-time nor accurate. The data and prices on the website are not necessarily provided by any market or exchange, but may be provided by market makers, and so prices may not be accurate and may differ from the actual price at any given market, meaning prices are indicative and not appropriate for trading purposes. Fusion Media and any provider of the data contained in this website will not accept liability for any loss or damage as a result of your trading, or your reliance on the information contained within this website.
It is prohibited to use, store, reproduce, display, modify, transmit or distribute the data contained in this website without the explicit prior written permission of Fusion Media and/or the data provider. All intellectual property rights are reserved by the providers and/or the exchange providing the data contained in this website.
Fusion Media may be compensated by the advertisers that appear on the website, based on your interaction with the advertisements or advertisers.