Beta Is A Useful Risk Metric, If You Use It Correctly
James Picerno | Nov 24, 2020 08:19AM ET
In a world awash in identified risk factors, the original quantitative profile of investment risk long ago fell from grace. If you spend ten minutes on the internet searching for research that finds beta to be irrelevant, at best, you’ll quickly line up reading material for a month. But the majority of the criticism focuses on beta’s weakness for parsing individual stocks. By that standard, beta suffers several well-known and reportedly fatal flaws as a risk measure. But applied to asset classes in the context of portfolio design and management, beta’s far from dead.
Beta, of course, is the risk metric in the capital asset pricing model (CAPM) and quantifies the relationship between an investment and the portfolio. A beta of 1.0 indicates that an investment’s risk profile matches the market portfolio’s risk. Higher (lower) betas equate with relatively higher (lower) risk.
As numerous studies over the years have shown, beta has minimal, if any, value for analyzing individual stocks. A key issue: low-beta shares tend to outperform high-beta shares. Not good if you’re expecting beta to proxy for risk. Therein lies the basis for the success of low-volatility equity portfolios, which violates CAPM’s logic.
Beta’s track record is wobbly at best for stock portfolios, but the risk metric looks better for multi-asset-class strategies. Perhaps that’s not surprising since CAPM is focused on the “market” portfolio, which in theory holds all assets. By that standard, trying to use beta and CAPM in an equity-only context is asking for trouble.
As a toy example, consider how beta and return compare for the major asset classes, based on a set of proxy ETFs:
The chart below plots these ETFs for beta vs. trailing 5-year annualized total return. The relationship isn’t perfect, but there’s a general connection between risk and return a la CAPM. Higher return tends to align with higher return.
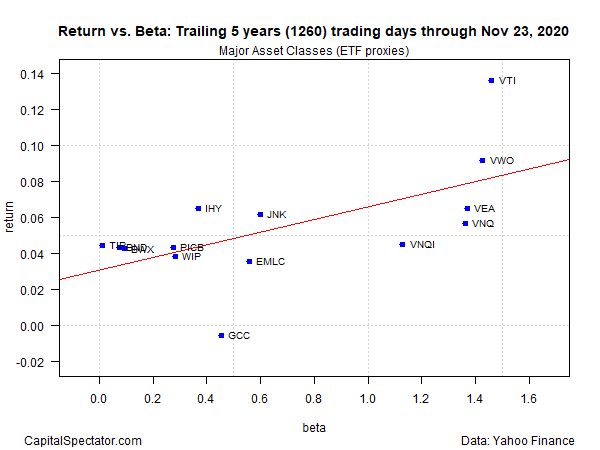
To be fair, beta only captures a piece of the risk profile. If it was a perfect risk metric and told you everything you needed to know about risk, all the blue squares in the chart above would line up directly on the red line, which reflects the regression for return vs. beta. Unfortunately for investors, the real world is messy and so beta’s imperfect. But that’s a long way from saying beta’s irrelevant or useless. Indeed, if we limited our analytics to risk metrics that were 100% perfect, we’d be left with nothing.
One of beta’s uses is helping us identify outliers – markets that may be unusually overbought or oversold, a.k.a. as markets that aren’t in equilibrium, to use the language of CAPM.
In the long run, the CAPM probably holds. If so, short-run cases of dis-equilibrium reflect useful bits of market intelligence.
With that in mind, running beta analytics over shorter periods can help us put a multi-asset class portfolio into sharper focus from a tactical perspective. For instance, the next chart below shows how the ETFs listed above stack up for return vs. beta over the trailing 120-trading-day period.
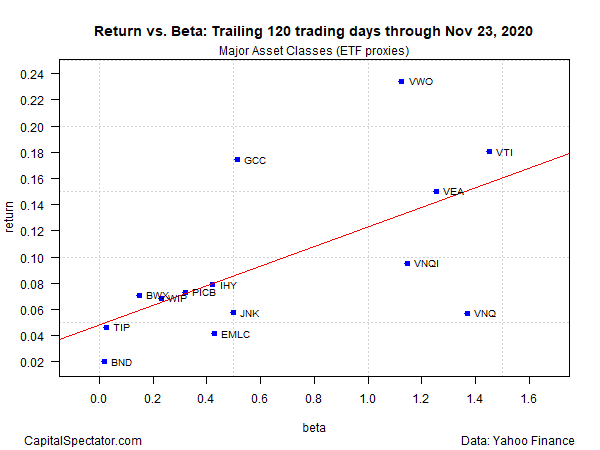
Looking at the two charts implies that US stocks (VTI) and emerging-markets stocks (VWO) have been running hot lately. Meanwhile, US REITs (VNQ) and foreign real estate (VNQI) have been relatively weak.
In theory, all the funds will align at or close to the red line through time, which implies that relatively large deviations from this point of equilibrium reflect opportunities for tilting weights in a multi-asset-portfolio strategy (or at least assets that deserve closer inspection).
Beta is only one tool in the toolkit and shouldn’t be used in isolation and the charts above represent the a simple example of a first step for this line of research. Meantime, every risk metric is flawled, which means that we should analyze markets from multiple perspectives using a range of quantitative (and perhaps qualitative) measures. But in assembling your toolkit, don’t be too quick to throw out beta. To paraphrase George Box’s famous quote about models, all risk metrics are wrong, but some are useful.
Trading in financial instruments and/or cryptocurrencies involves high risks including the risk of losing some, or all, of your investment amount, and may not be suitable for all investors. Prices of cryptocurrencies are extremely volatile and may be affected by external factors such as financial, regulatory or political events. Trading on margin increases the financial risks.
Before deciding to trade in financial instrument or cryptocurrencies you should be fully informed of the risks and costs associated with trading the financial markets, carefully consider your investment objectives, level of experience, and risk appetite, and seek professional advice where needed.
Fusion Media would like to remind you that the data contained in this website is not necessarily real-time nor accurate. The data and prices on the website are not necessarily provided by any market or exchange, but may be provided by market makers, and so prices may not be accurate and may differ from the actual price at any given market, meaning prices are indicative and not appropriate for trading purposes. Fusion Media and any provider of the data contained in this website will not accept liability for any loss or damage as a result of your trading, or your reliance on the information contained within this website.
It is prohibited to use, store, reproduce, display, modify, transmit or distribute the data contained in this website without the explicit prior written permission of Fusion Media and/or the data provider. All intellectual property rights are reserved by the providers and/or the exchange providing the data contained in this website.
Fusion Media may be compensated by the advertisers that appear on the website, based on your interaction with the advertisements or advertisers.