Best Stock Market Indicator Update
Doug Short | Feb 19, 2016 12:36AM ET
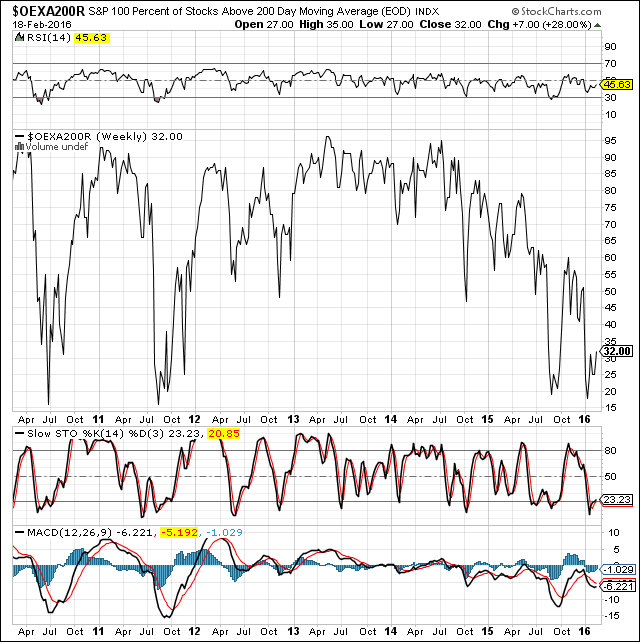
We continue to receive requests for updates to the "Best Stock Market Indicator", which used to be a regular guest post from John Carlucci. Here is an update of the "Carlucci" indicator along with a summary of John's explanation on how he uses it.
As John described it: "The $OEXA200R (the percentage of S&P 100 stocks above their 200 DMA) is a technical indicator available on StockCharts.com used to find the "sweet spot" time period in the market when you have the best chance of making money."
Latest Indicator Position
According to this system, the market is now untradeable and a signal to exit all long positions. The OEXA200R is well below 65%, currently at 32% and two out of three secondary indicators are negative:
- RSI is NEGATIVE (below 50)
- Slow STO is POSITIVE (black line below red line)
- MACD is NEGATIVE (black line below red line)

Background on the "Carlucci" Indicator
The OEXA200R is a metric used to assess the state of the market in order to make profitable trading decisions. That is, whether we are in a bull market, a bear market or transitioning from one to the other, as well as market volatility and risk within each of those situations. Historically, it has also given traders a clear early warning signal of impending serious market downturns and later safe re-entry points. While not intended as a day trading tool per se, it can certainly be used as background information by highly speculative traders. Simply put, the OEXA200R gives traders the ability to identify the most opportune conditions within which to execute their various long, short or hold strategies.
Definition of Terms:
"Tradable" refers to the point at which it is most advantageous to enter and continue long trading.
"Un-tradable" refers to the point at which it is advisable to exit all long positions that have not already automatically closed with a trailing stop loss. Please be aware that the OEXA exit points are not always timed at the exact top of any run up, that is impossible to predict. However, a trailing stop will follow the price to the highest point and close out as it falls from there, meaning most positions should have closed before the OEXA exit signal appears and thus should close at a point higher than at the exit signal.
Following a major market correction, the conditions for safe re-entry are when:
a) Daily $OEXA200R rises above 65%
And two of the following three also occur:
b) Weekly RSI rises over 50
c) Weekly MACD black line rises above red line
d) Weekly Slow STO black line rises above red line
Without the solid foundational support of two out of three Weekly secondary indicators, it is unsafe to trade even if Daily OEXA200R edges above the 65% line. The market is considered safely tradable as long as Daily OEXA200R remains above 65% and two weekly secondary indicators remain positive. Volatility and risk for long traders are relatively low. The trend is on their side.
Conversely, when Daily OEXA200R drops below 65% and/or two out of three weekly secondary indicators turn negative it, is taken as the conservative signal to exit all long positions, even if the previous Weekly OEXA is above 65%. Volatility and risk increase substantially. In the past, this has often been a "tipping point" condition presaging a substantial market drop.
On a Personal Note: The "Carlucci" indicator is certainly an interesting metric, although it can be quite volatile over extended periods of time. Thus we don't see it as suitable for trend-following strategies -- for example, buying/selling based on monthly moving averages, as in The Ivy Portfolio system. However, it is certainly worth considering as a tool for gauging market health.
Trading in financial instruments and/or cryptocurrencies involves high risks including the risk of losing some, or all, of your investment amount, and may not be suitable for all investors. Prices of cryptocurrencies are extremely volatile and may be affected by external factors such as financial, regulatory or political events. Trading on margin increases the financial risks.
Before deciding to trade in financial instrument or cryptocurrencies you should be fully informed of the risks and costs associated with trading the financial markets, carefully consider your investment objectives, level of experience, and risk appetite, and seek professional advice where needed.
Fusion Media would like to remind you that the data contained in this website is not necessarily real-time nor accurate. The data and prices on the website are not necessarily provided by any market or exchange, but may be provided by market makers, and so prices may not be accurate and may differ from the actual price at any given market, meaning prices are indicative and not appropriate for trading purposes. Fusion Media and any provider of the data contained in this website will not accept liability for any loss or damage as a result of your trading, or your reliance on the information contained within this website.
It is prohibited to use, store, reproduce, display, modify, transmit or distribute the data contained in this website without the explicit prior written permission of Fusion Media and/or the data provider. All intellectual property rights are reserved by the providers and/or the exchange providing the data contained in this website.
Fusion Media may be compensated by the advertisers that appear on the website, based on your interaction with the advertisements or advertisers.