Bearish Triangle On USD/MXN Points Lower: Elliott Wave Analysis
Gregor Horvat | Aug 18, 2020 06:48AM ET
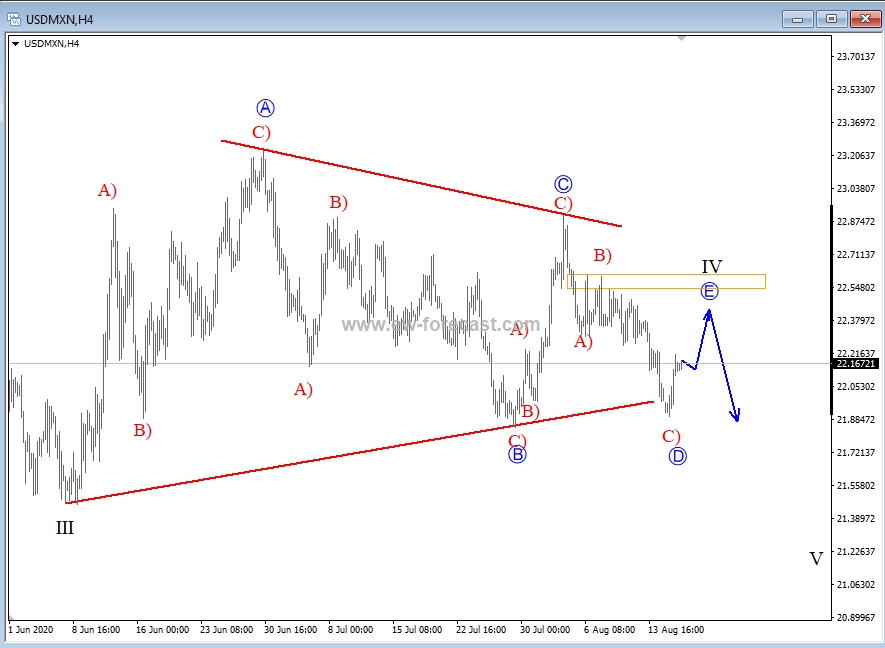
USD/MXN is trading sideways since the beginning of June and it looks like it is forming a big, bearish Elliott wave triangle in wave IV that can send the price even lower for a wave V, once fully developed. That said, we see four of the needed five legs within a triangle as finished, so the latest intra-day rally from the lower triangle line can be part of a final leg E of IV. Possible resistance and a new reversal zone for the pair can be at 22.4/22.5 area.
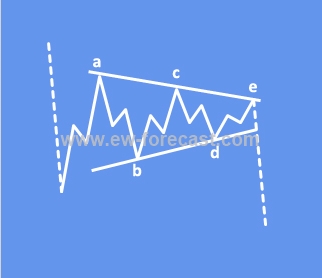
A Triangle is a common 5-wave pattern labeled A-B-C-D-E that moves countertrend and is corrective in nature. Triangles move within two channel lines drawn from waves A to E, and from waves B to D. A Triangle is either contracting or expanding depending on whether the channel lines are converging or expanding. Triangles are overlapping five wave affairs that subdivide 3-3-3-3-3.
Triangles can occur in wave 4, wave B, wave X position or in some very rare cases also in wave Y of a combination.
Symmetrical triangle in downtrend:
Trade well!
Trading in financial instruments and/or cryptocurrencies involves high risks including the risk of losing some, or all, of your investment amount, and may not be suitable for all investors. Prices of cryptocurrencies are extremely volatile and may be affected by external factors such as financial, regulatory or political events. Trading on margin increases the financial risks.
Before deciding to trade in financial instrument or cryptocurrencies you should be fully informed of the risks and costs associated with trading the financial markets, carefully consider your investment objectives, level of experience, and risk appetite, and seek professional advice where needed.
Fusion Media would like to remind you that the data contained in this website is not necessarily real-time nor accurate. The data and prices on the website are not necessarily provided by any market or exchange, but may be provided by market makers, and so prices may not be accurate and may differ from the actual price at any given market, meaning prices are indicative and not appropriate for trading purposes. Fusion Media and any provider of the data contained in this website will not accept liability for any loss or damage as a result of your trading, or your reliance on the information contained within this website.
It is prohibited to use, store, reproduce, display, modify, transmit or distribute the data contained in this website without the explicit prior written permission of Fusion Media and/or the data provider. All intellectual property rights are reserved by the providers and/or the exchange providing the data contained in this website.
Fusion Media may be compensated by the advertisers that appear on the website, based on your interaction with the advertisements or advertisers.