Barclays XVZ as a Market Hedge—Backtest to 2004
Vance Harwood | Jan 05, 2012 04:12AM ET
In August 2011 Barclays introduced XVZ, the first of a new class of volatility funds that focus on protecting investors against tail risk. Tail risk events (or Black Swans as Taleb calls them) are the unfortunate tendency of markets to not behave like statisticians (or investors) would like them to. Typically markets are well behaved statistically, with daily returns clustered around zero. The chart below shows the behavior of the S&P compared to a Bell curve, or Gaussian /normal distribution.
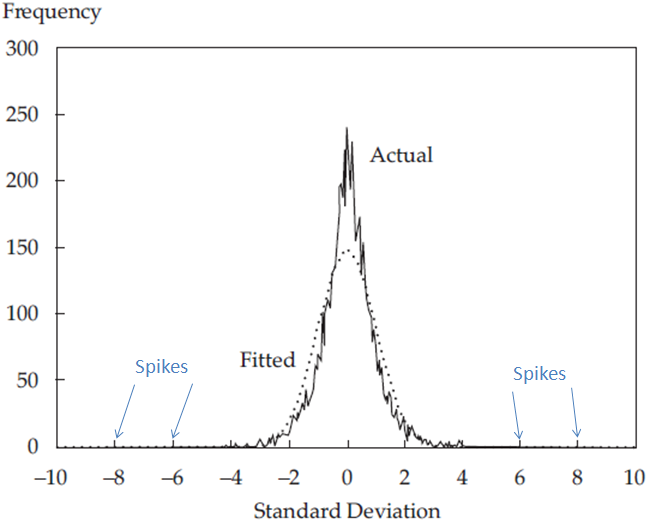
S&P daily returns
At first glance, the match looks good, with the primary difference being the S&P has more go-nowhere days than the normal distribution. However the chart points out market spikes on both sides that don’t match the normal distribution at all. The normal distribution predicts that 6 standard deviation (or 6 sigma) events should happen only in around once out of 2.5 million trading days (~ 12,000 years). Instead we have had them multiple times in recent decades. These long tail events wreck havoc on portfolios designed around the normal distribution. Years of gains are wiped out in days…
XVZ is designed to hold its value until these negative outlier events occur, and then it switches into action, aggressively increasing in value as volatility indexes spike up during the crash. Adding XVZ to your portfolio has the effect of buying insurance against crashes. The open questions are how much does this insurance cost, and how much is needed to hedge your portfolio. Backtesting XVZ, to see how it would have performed in the past helps us get a feel (although no guarantee) for those factors.
The VIX/VXV ratio is the key driver for XVZ’s operation. Unfortunately the CBOE only provides daily VXV (93 day implied volatililty) data back to December 2007 on their website. This is a showstopper for direct backtesting before that time. However, I wondered if the ratio of the daily nearest month VIX volatility future settlement value, divided by the 3rd month VIX volatility future might be a reasonable surrogate. The next chart shows these two ratios compared.
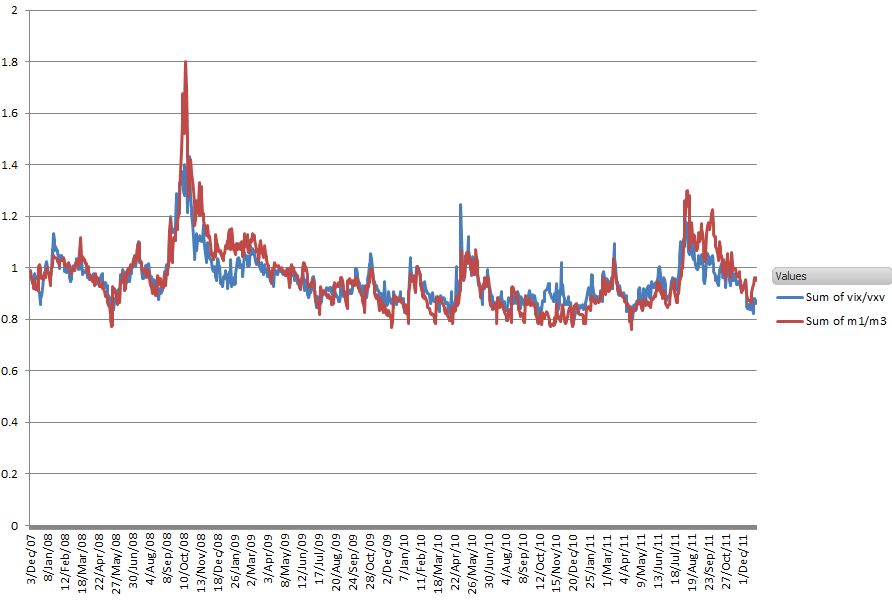
VIX/VXV vs Nearest / 3rd Month VIX Futures settlement
Not bad. The next chart shows my XVZ backtest simulation using the VIX/VXV ratio and the Futures M1/M3 ratio.
XVZ backtest vix/vxv and VIX futures M1/M3
Again, not bad. Especially encouraging is the close match in the earlier 2007 timeframe, relatively quiet times that were similar to the 2004 through 2006 market action. Using the M1/M3 ratio, which my VIX futures spreadsheet has back to March 2004, I obtain the following result:
It looks like XVZ would have been quiet in 2004 through 2007, serving its hedge function without losing value. More recent data suggest that in quiet markets XVZ will lose some value due to increased contango on medium term volatilty futures. Adding the VIX index and SPY as a surrogate for the S&P 500 we have a composite picture below that reinforces the notion that XVZ is a good hedge against market crashes.
Bottom line, by this simulation (ignoring dividends) a $300 investment in XVZ on March 29, 2004 would have protected (no net capital loss) a $1000 investment in SPY (market bottom March 6, 2009, $XVZ+$SPY = $1338) and returned 67% overall (30-Dec-2011) compared to 11% for a SPY only investment. A difference in compound annual growth of 6.8% vs 1.6%.
Trading in financial instruments and/or cryptocurrencies involves high risks including the risk of losing some, or all, of your investment amount, and may not be suitable for all investors. Prices of cryptocurrencies are extremely volatile and may be affected by external factors such as financial, regulatory or political events. Trading on margin increases the financial risks.
Before deciding to trade in financial instrument or cryptocurrencies you should be fully informed of the risks and costs associated with trading the financial markets, carefully consider your investment objectives, level of experience, and risk appetite, and seek professional advice where needed.
Fusion Media would like to remind you that the data contained in this website is not necessarily real-time nor accurate. The data and prices on the website are not necessarily provided by any market or exchange, but may be provided by market makers, and so prices may not be accurate and may differ from the actual price at any given market, meaning prices are indicative and not appropriate for trading purposes. Fusion Media and any provider of the data contained in this website will not accept liability for any loss or damage as a result of your trading, or your reliance on the information contained within this website.
It is prohibited to use, store, reproduce, display, modify, transmit or distribute the data contained in this website without the explicit prior written permission of Fusion Media and/or the data provider. All intellectual property rights are reserved by the providers and/or the exchange providing the data contained in this website.
Fusion Media may be compensated by the advertisers that appear on the website, based on your interaction with the advertisements or advertisers.