AUD/USD Holds Channel Support as Hawkish RBA Minutes Offset Weak Jobs Data
MarketPulse | Jul 22, 2025 09:56AM ET
Most majors have appreciated the latest bout of dovishness from the FED Speakers as they entered the blackout period (2 weeks before FED Meeting where they can't mention Monetary Policy).
The US Dollar Index has fell below the 98.00 level, key barometer for appetite after having failed to even reach 99.00 on the July USD run-up. This allowed AUD/USD to find some form of bottom before markets see more data.
The Australian Dollar had actually held pretty strong compared to its neighbor NZD for example, after holding their rates at the July 8th Meeting, before Markets saw disappointing Jobs data the week after and decided to still sell the Aussie.
As a matter of fact, the RBA Minutes got published overnight (You can access them right here), mentioning some important factors to consider:
The first being how the Royal Bank of Australia wants to keep the cuts gradual ("3 out of 4 meeting is too much"), global outlooks are not as bad as expected, Job Market hasn't loosened as much as expected and still looking to measure if the Mon. Policy is restrictive as they don't want it to become too loose.
Except for a comment on subdued GDP that could be hurt further by tariffs, the overall comments are surprisingly hawkish – the Australian Cut cycle might not be as smooth as market had previously priced.
Aussie Multi-Timeframe Technical Analysis
AUD/USD Daily Chart – Double Top, But ...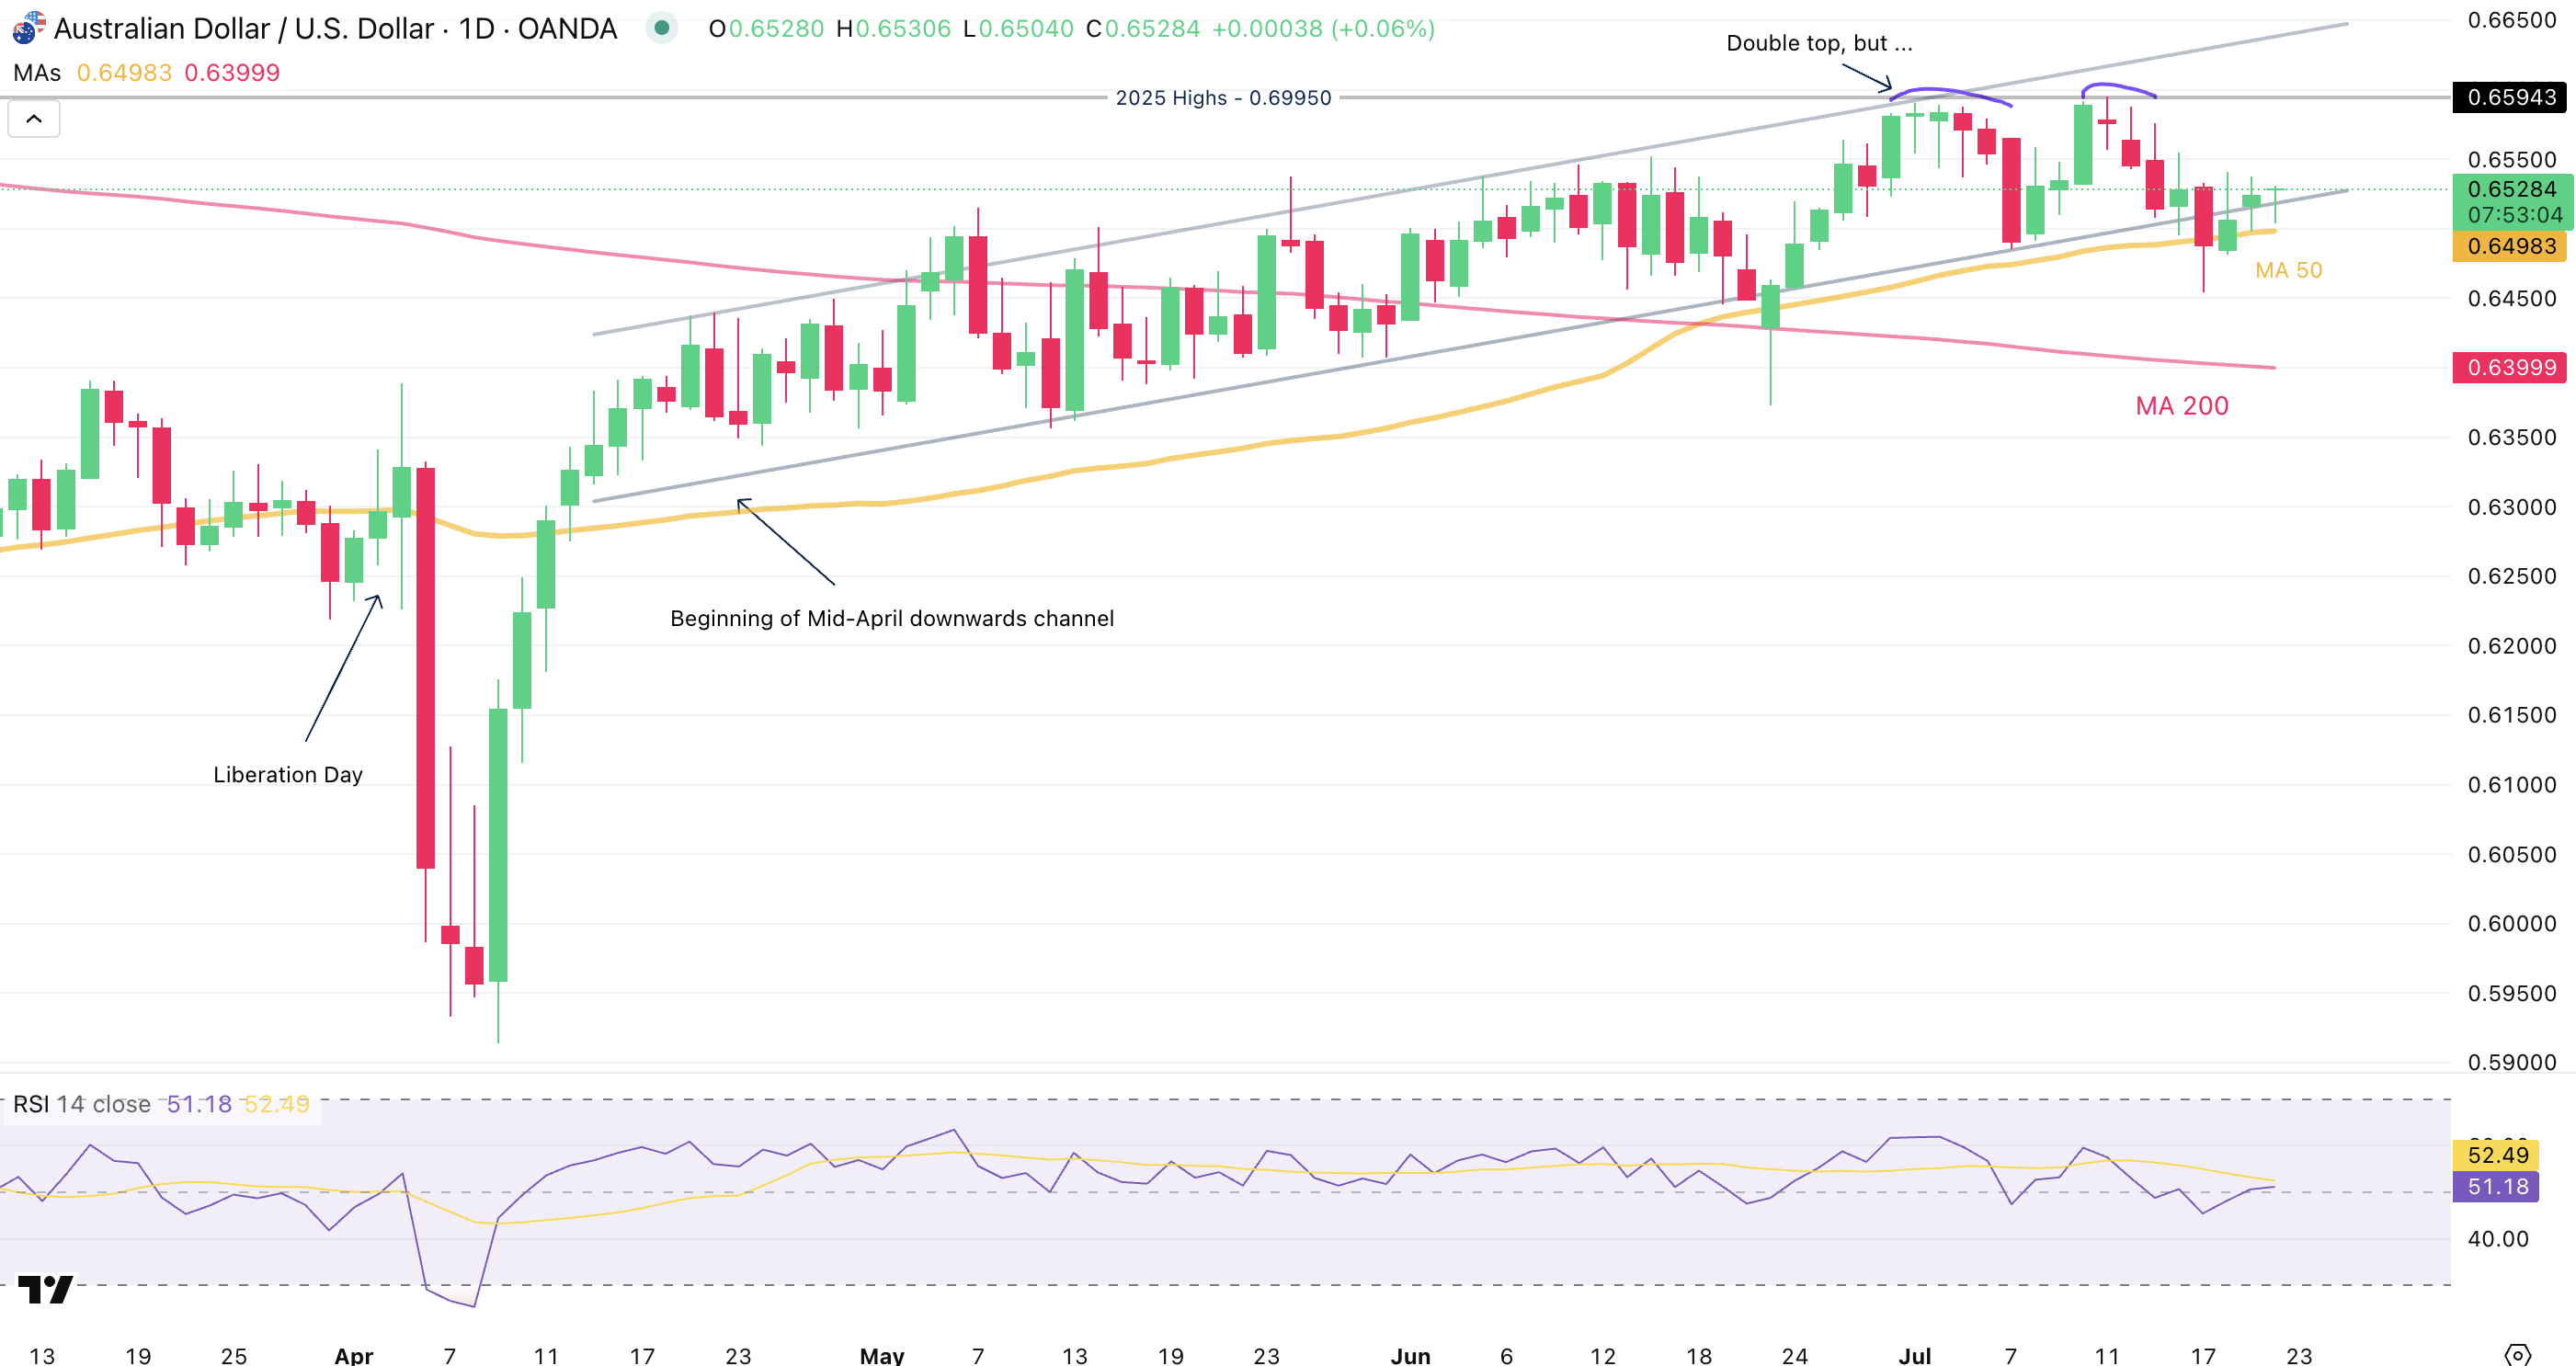
Source: TradingView
The Pair is currently holding its April upwards channel despite showing signs of breaking before USD weakness and surprisingly hawkish RBA Minutes saved the pair at the 50-Day Moving Average, acting as immediate support.
Sellers will want to create new lows before the end of the week to keep their hand, but having failed to hold below the key MA, the action looks more rangebound leaving some chances for buyers to step in at the low of the channel.
AUD/USD 8H Chart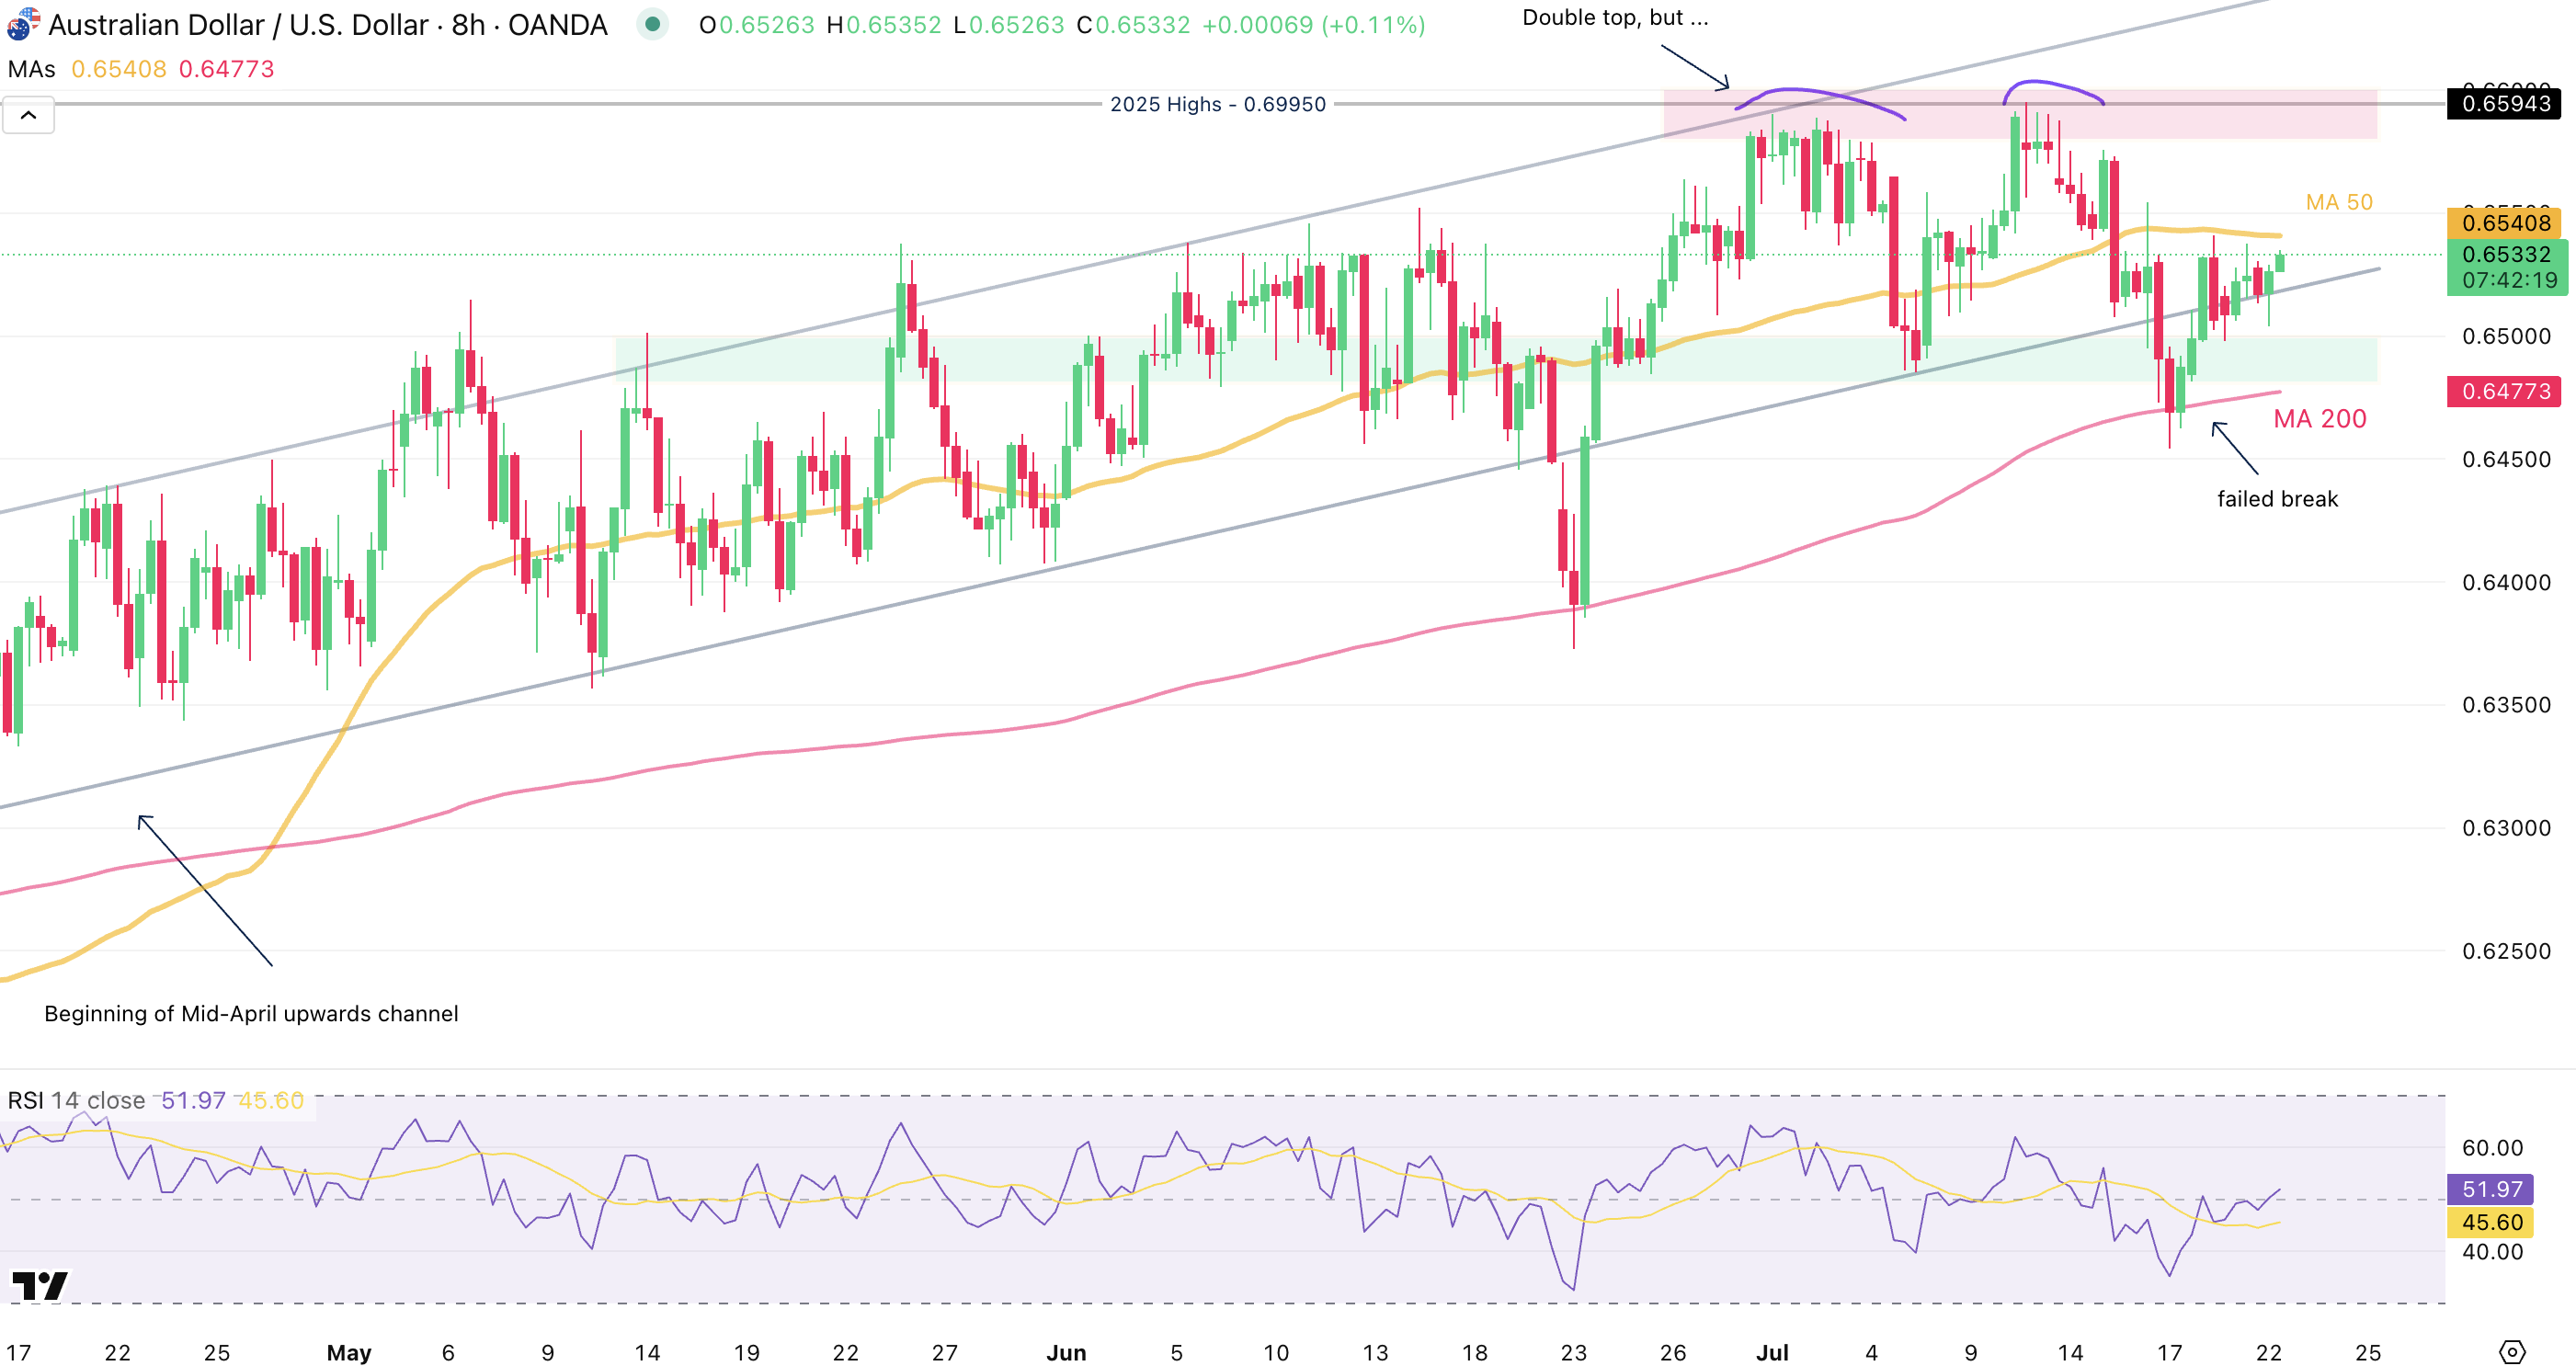
Source: TradingView
A small parenthesis on the 8H Chart to show how buyers stepped in a key moving averages from different other timeframes.
See how the MA 200 (around 0.6480) will be now confirmed as key support for the major trend, with buyers having to breach the 8H MA 50 (0.6540) to regain momentum.
AUD/USD 4H Chart
Source: TradingView
Looking even closer shows more light on the range that has been formed by the failed breakdown.
Buyers are now stepping in, turning the immediate RSI momentum upwards.
Low of range is located at the 0.6480 to 0.65 Support Zone, while the highs of the range are at the 0.6580 to 0.66 Resistance Zone.
Any break on a lot of volume and preferably daily and/or weekly closes below/above these levels will point to further breakouts, but these are not the signs we are seeing for now.
AUD/USD 1H Chart
Source: TradingView
Buyers have held a retest of the lower trendline, forming what could be a short-term double-bottom – a failure to break the 0.6540 (coinciding with the 8H MA 50) will point towards a rangebound consolidation.
Safe Trades!
Trading in financial instruments and/or cryptocurrencies involves high risks including the risk of losing some, or all, of your investment amount, and may not be suitable for all investors. Prices of cryptocurrencies are extremely volatile and may be affected by external factors such as financial, regulatory or political events. Trading on margin increases the financial risks.
Before deciding to trade in financial instrument or cryptocurrencies you should be fully informed of the risks and costs associated with trading the financial markets, carefully consider your investment objectives, level of experience, and risk appetite, and seek professional advice where needed.
Fusion Media would like to remind you that the data contained in this website is not necessarily real-time nor accurate. The data and prices on the website are not necessarily provided by any market or exchange, but may be provided by market makers, and so prices may not be accurate and may differ from the actual price at any given market, meaning prices are indicative and not appropriate for trading purposes. Fusion Media and any provider of the data contained in this website will not accept liability for any loss or damage as a result of your trading, or your reliance on the information contained within this website.
It is prohibited to use, store, reproduce, display, modify, transmit or distribute the data contained in this website without the explicit prior written permission of Fusion Media and/or the data provider. All intellectual property rights are reserved by the providers and/or the exchange providing the data contained in this website.
Fusion Media may be compensated by the advertisers that appear on the website, based on your interaction with the advertisements or advertisers.