AUD/USD’s “Spidey Sense” is Tingling
Matthew Weller | Nov 25, 2014 02:28PM ET
Much like my wife, markets almost never give clear, unambiguous signals. Last week’s surprise decision by the PBOC to cut interest rates for the first time in more than two years provides the perfect example. Immediately following the decision, traders bid up the AUD/USD, reasoning that more stimulus in China should benefit the country’s imports and by extension, trading partners like Australia and New Zealand.
However, an opposing narrative has emerged this week, helped along by RBA Assistant Governor Philip Lowe’s comments last night. In comments at an Australian Business Economists dinner, Lowe hinted that commodity prices may continue to fall and that the Reserve Bank of Australia stood ready to cut interest rates further if required. Most have attributed these comments to typical “verbal intervention” to drive the AUD lower from the RBA, in-line with its actions over the last few years. That said, these new comments have caused some traders to ponder whether China’s surprise interest rate cut could have been prompted by an upcoming negative shock from the world’s second-largest economy, a slowdown that may also be starting to show up in Australia’s economic data.
While we hesitate to venture too far down the rabbit hole of speculation, a major disruption in Chinese economic growth, if seen, could lead to a steep drop in the China-dependent Australian and New Zealand dollars, among other currencies. It would also stoke safe-haven demand for currencies like the U.S. dollar and Japanese yen. The recent developments in the Asian-Pacific region have the proverbial “spidey sense” of some traders tingling, so readers should closely monitor economic data out of China and Australia the next few weeks to see if it corroborates this fringe theory.
Technical View: AUD/USD
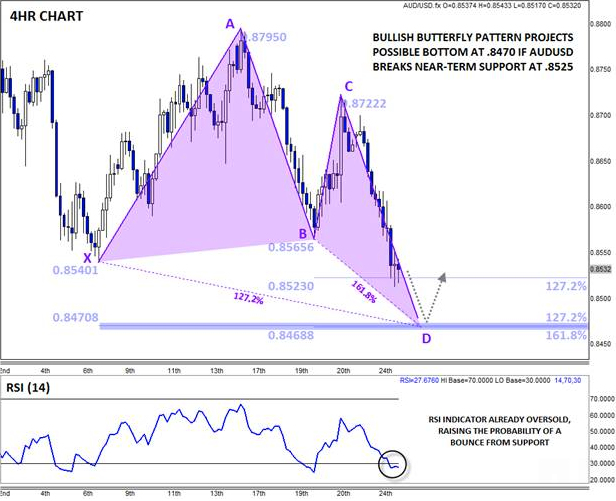
Not surprisingly, AUD/USD has dropped on the back of RBA Lowe’s dovish comments. As we go to press, the pair is testing support at the 127.2% Fibonacci extension support of Friday’s bounce at .8523, but a developing technical pattern suggests that a much stronger level of support sits down at .8470.
That level marks the convergence of the 127.2% Fibonacci extension of XA, 161.8% extension of BC, and the AB=CD pattern off the monthly highs. The confluence of these leading technical support levels creates a Bullish Butterfly pattern, suggesting a higher probability of a bottom if rates drop down to pattern completion at .8470. Bolstering the bullish case, the RSI indicator is already oversold raising the probability of a rally off support. In the near term then, a deeper pullback is possible, but buyers are likely to emerge if rates dip below .8500 later this week.
Source: FOREX.com
For more intraday analysis and market updates, follow us on twitter (@MWellerFX and @FOREXcom).
Trading in financial instruments and/or cryptocurrencies involves high risks including the risk of losing some, or all, of your investment amount, and may not be suitable for all investors. Prices of cryptocurrencies are extremely volatile and may be affected by external factors such as financial, regulatory or political events. Trading on margin increases the financial risks.
Before deciding to trade in financial instrument or cryptocurrencies you should be fully informed of the risks and costs associated with trading the financial markets, carefully consider your investment objectives, level of experience, and risk appetite, and seek professional advice where needed.
Fusion Media would like to remind you that the data contained in this website is not necessarily real-time nor accurate. The data and prices on the website are not necessarily provided by any market or exchange, but may be provided by market makers, and so prices may not be accurate and may differ from the actual price at any given market, meaning prices are indicative and not appropriate for trading purposes. Fusion Media and any provider of the data contained in this website will not accept liability for any loss or damage as a result of your trading, or your reliance on the information contained within this website.
It is prohibited to use, store, reproduce, display, modify, transmit or distribute the data contained in this website without the explicit prior written permission of Fusion Media and/or the data provider. All intellectual property rights are reserved by the providers and/or the exchange providing the data contained in this website.
Fusion Media may be compensated by the advertisers that appear on the website, based on your interaction with the advertisements or advertisers.